


Bitcoin price bounces 4% as data gives ‘89% chance’ stocks bottom is in


Bitcoin (BTC) rebounded above $81,000 on March 11 as US stocks’ futures sought relief from a brutal sell-off. BTC/USD 1-hour chart. Source: Cointelegraph/TradingView

BTC price bounces back amid calls for short squeeze
Data from Cointelegraph Markets Pro and TradingView showed daily BTC price gains approaching 4%.
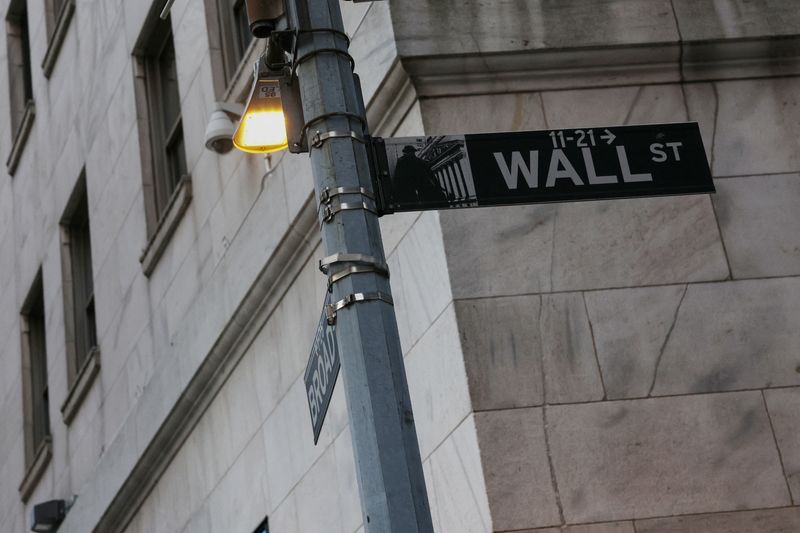
New four-month lows had accompanied the previous day’s Wall Street trading session as recession fears sent risk-asset investors fleeing.
The S&P 500 and Nasdaq Composite Index finished the day down 2.7% and 4%, respectively. At the time of writing, Nasdaq 100 futures had recovered around 0.4% from a trip to their lowest levels since September 2024.
Commenting, trading resource The Kobeissi Letter suggested that markets had entered an unsustainable downtrend.
“Are we overdue for a massive short squeeze?” it queried in a thread on X, noting risk-asset sentiment in “extreme fear” territory.
“Even bears who are calling for a prolonged bear market would need to see some relief rallies. Markets do not move in a straight-line long-term. Eventually, a (tradable) short squeeze is inevitable.”

Nasdaq 100 futures 1-day chart. Source: Cointelegraph/TradingView
Kobeissi and others referenced unusually high readings from the VIX volatility index while making the case for a sustained recovery.
“$VIX has only been higher 11% of the time, going back to 1990,” network economist Timothy Peterson, creator of several Bitcoin price forecasting tools, continued.
“Put another way, there is an 89% chance that today was the bottom.”

VIX volatility index. Source: Timothy Peterson/X
Bitcoin analysis sees “very rough time” ahead
Bitcoin thus saw some much-needed upside on short timeframes after reaching $76,600 on Bitstamp.
Related: Biggest red weekly candle ever: 5 things to know in Bitcoin this week
“$BTC just had a bullish divergence on the 4H timeframe,” trader Cas Abbe said while analyzing relative strength index (RSI) signals.
“I'm not saying this is the reversal but a short-term pump looks imminent now.”

BTC/USD 4-hour chart with RSI data. Source: Case Abbe/X
Previously, trader and analyst Rekt Capital told X followers to watch for similar RSI cues from the daily chart to confirm a more sustainable BTC price comeback.
Zooming out, other popular crypto market participants remained gloomy. Among them was the pseudonymous X trader HTL-NL, who concluded that BTC/USD was unlikely to match all-time highs. BTC/USDT 1-day chart. Source: HTL-NL/X

“Before anyone of you think this is specifically happening in crypto: it’s not,” another of his latest posts said alongside a chart of S&P 500 futures.
“It happens to all risk off assets. It’s called a recession probably. US is in for a very tough time.”

S&P 500 futures 1-day chart. Source: HTL-NL/X
This article does not contain investment advice or recommendations. Every investment and trading move involves risk, and readers should conduct their own research when making a decision.