Bitcoin rally breaks from US stock market as mixed macro data creates bullish setup for BTC

Bitcoin's move above $80,000 is testing whether its latest break from the S&P 500 reflects a real macro regime shift or the market's most liquid risk switch reacting to two different clocks.
After months of Bitcoin following the US stock market open in terms of direction, volatility, and stress, it appears to be decoupling from the AI-fed S&P 500.
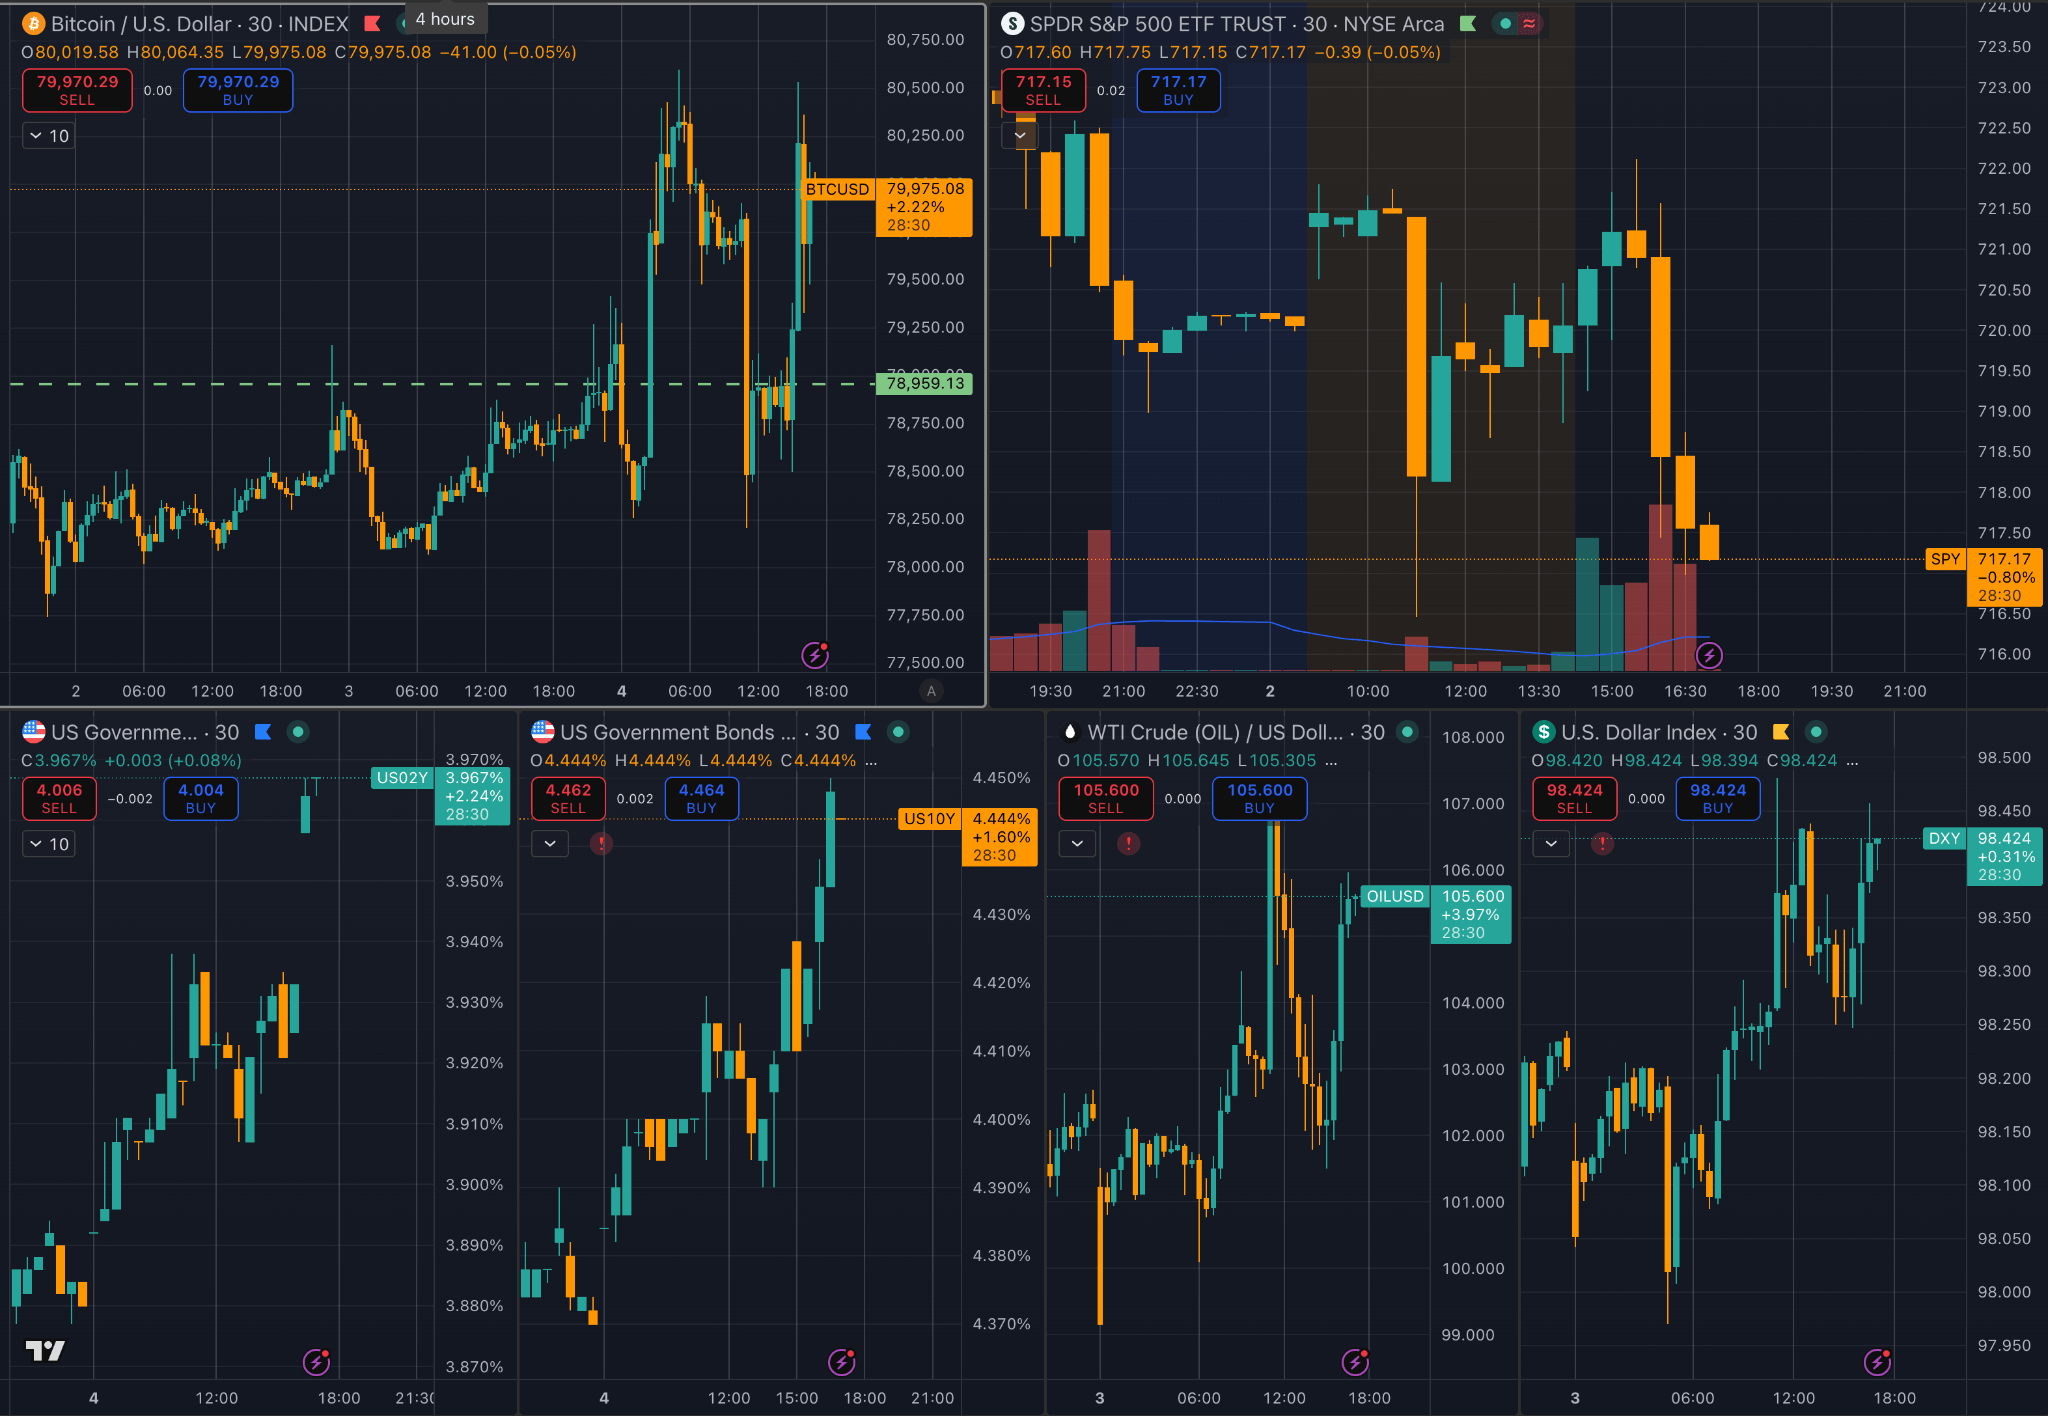
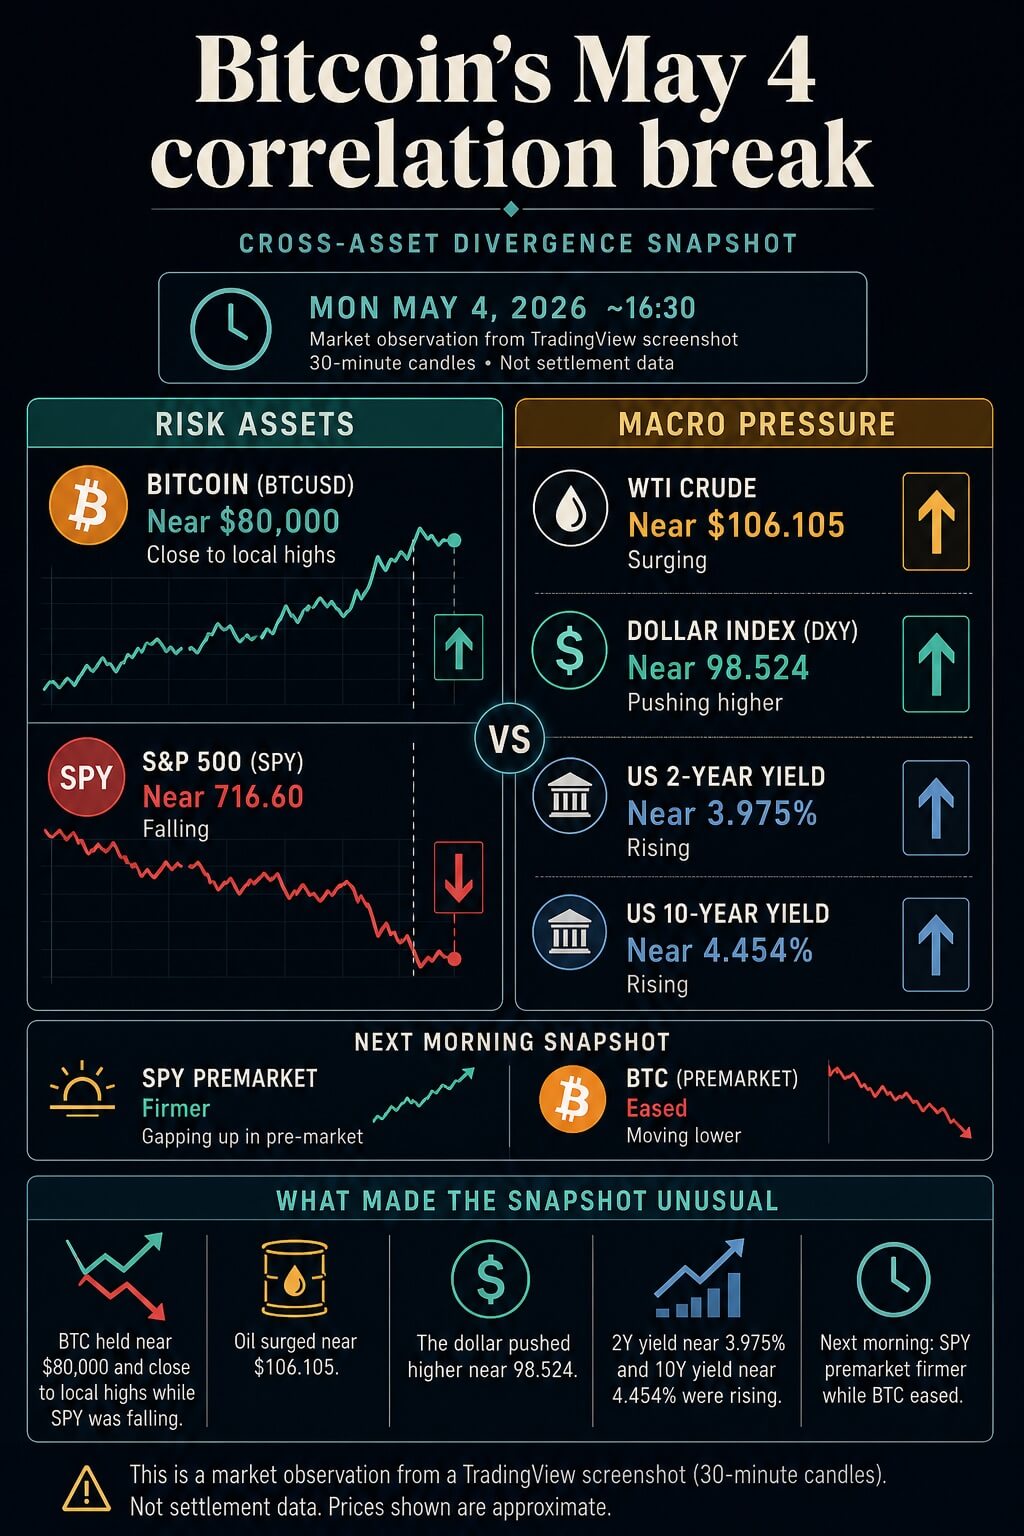
The contradiction showed up as the usual pressure points moved against equities. Oil jumped after the latest flare-up in the Iran war. Treasury yields moved higher. The dollar firmed. U.S. stocks fell from record levels.
Yet Bitcoin stayed near the $80,000 area instead of following SPY lower in the same way it had during earlier oil spikes.

The data points to a more complicated market than a clean refuge from stress. BTC may now be trading at the intersection of AI-led risk appetite, ETF-linked brokerage demand, and a geopolitical oil shock that is pushing bond markets back into focus.
The next morning made the setup harder to reduce to a single bullish story. Oil eased, U.S. futures edged higher, and the cross-asset split appeared to flip direction.
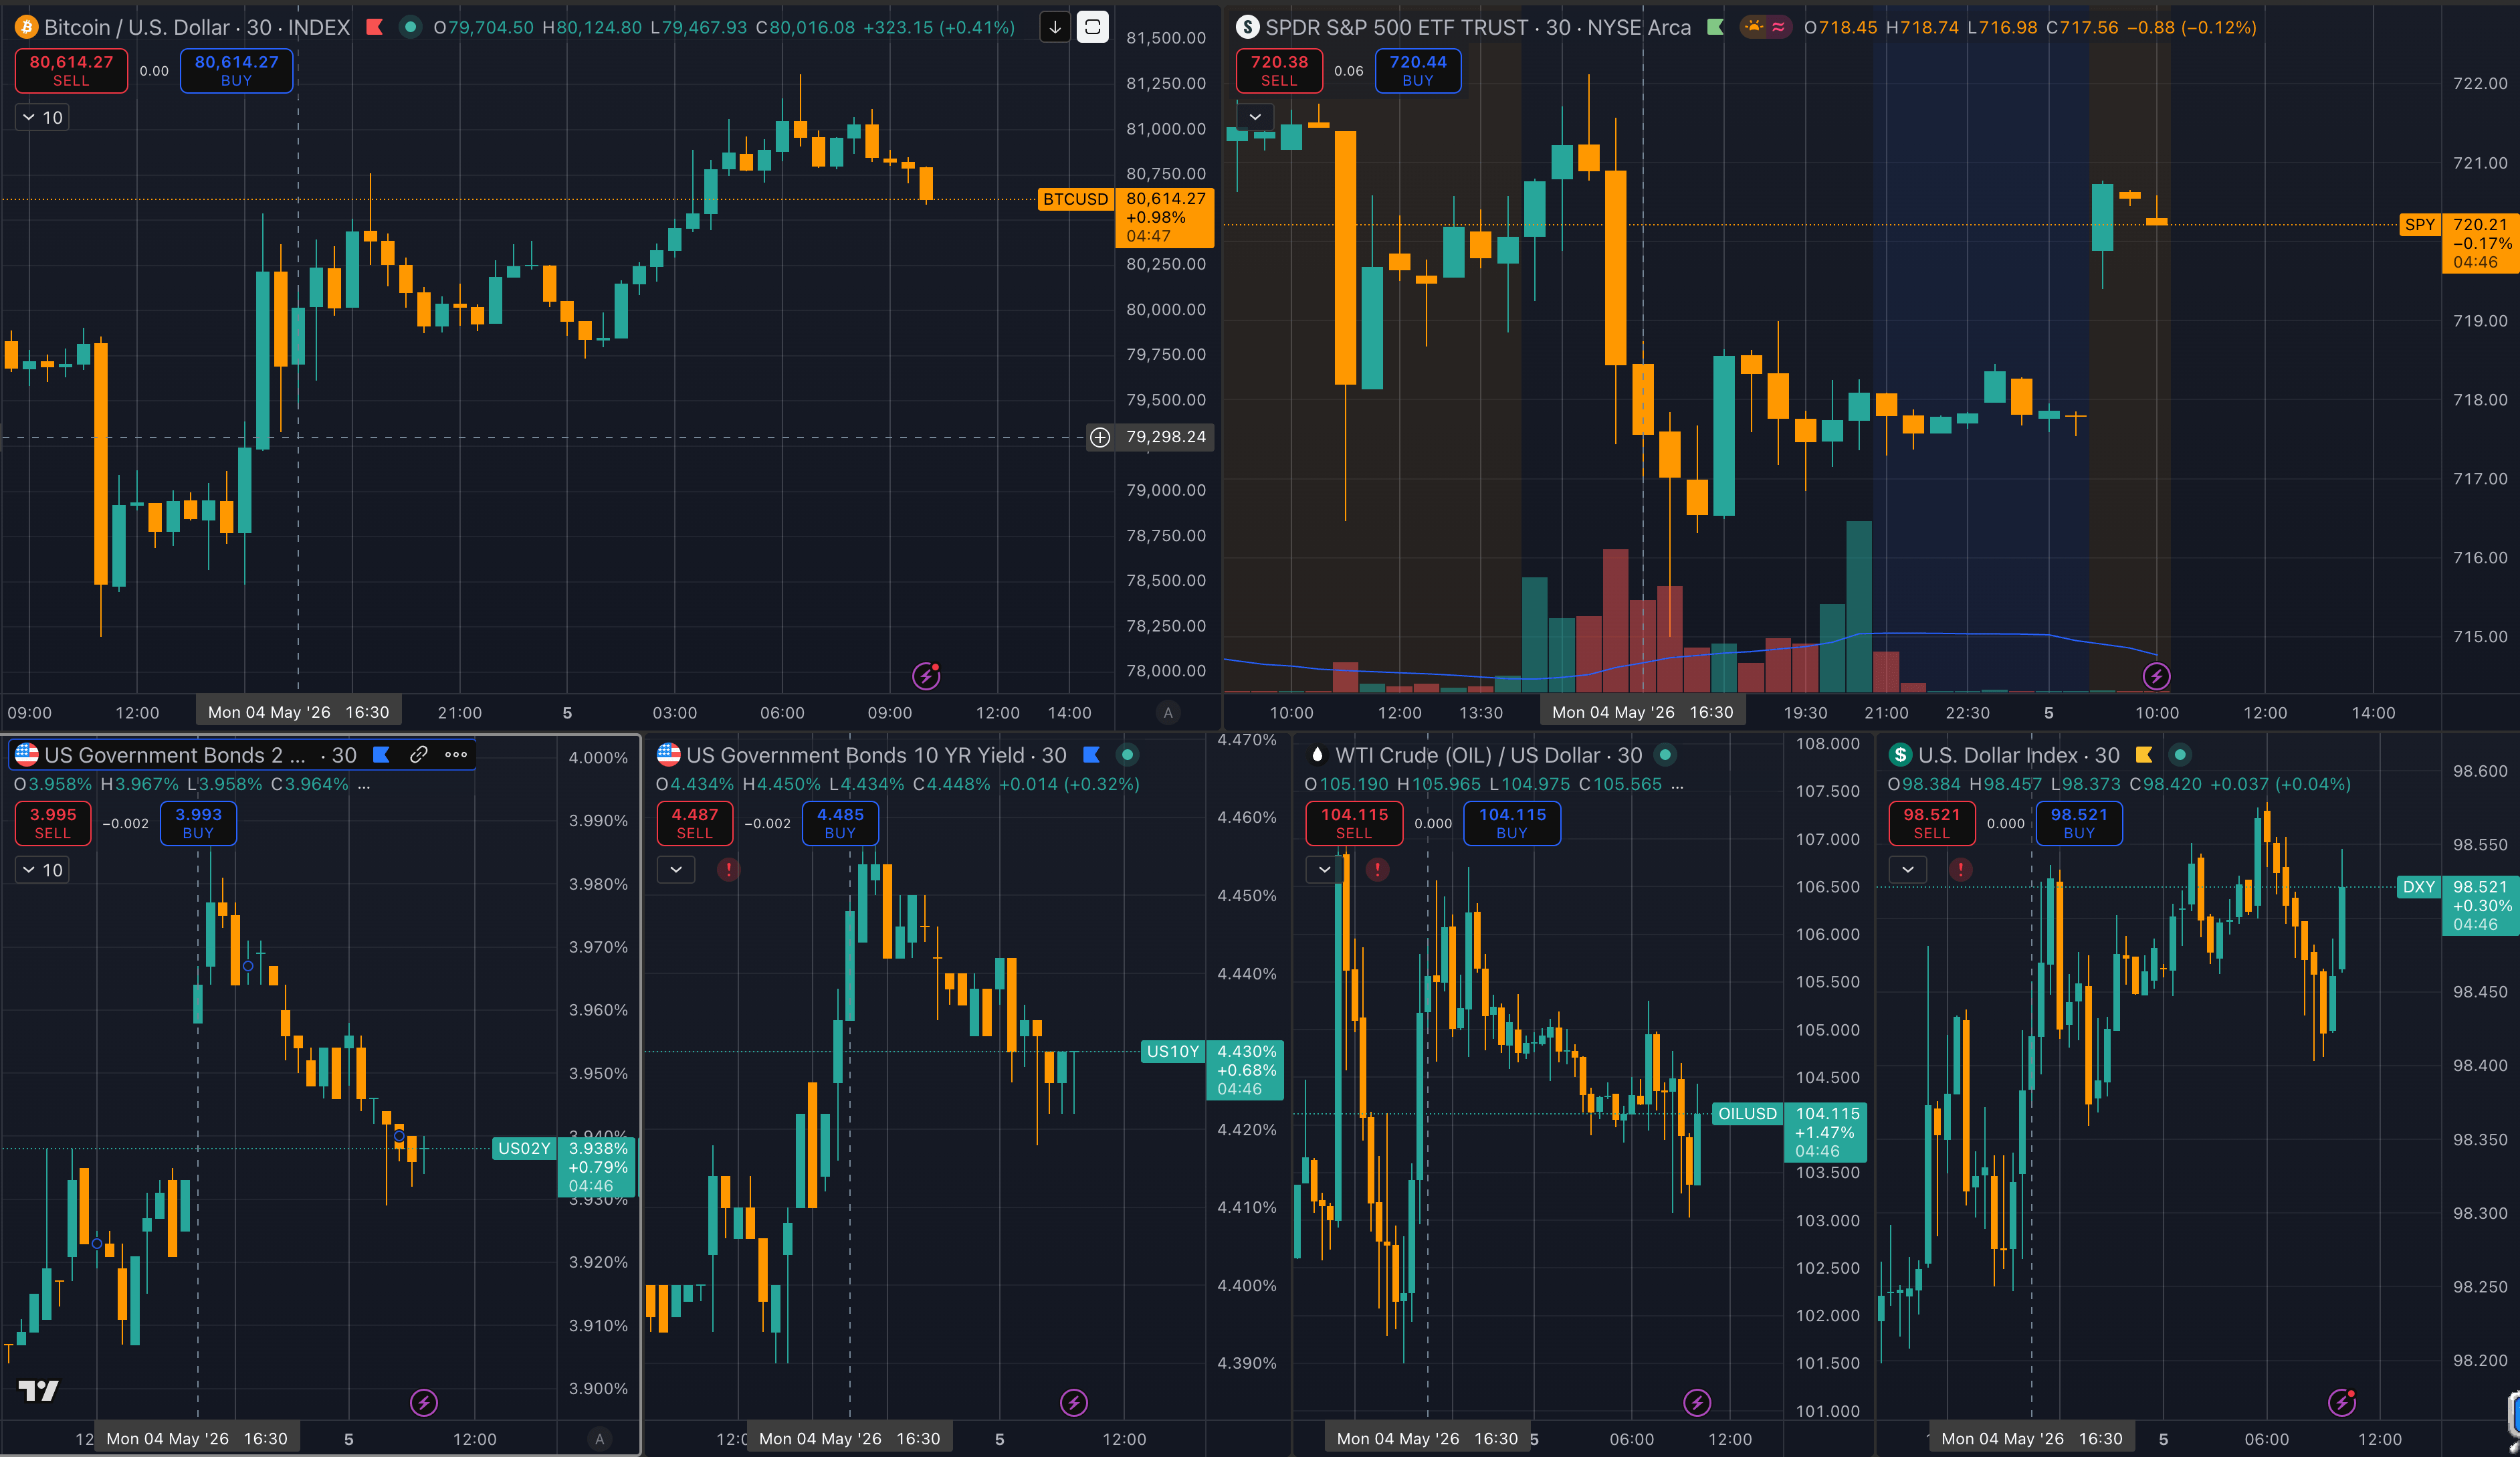
If Bitcoin can rise while SPY falls, then soften while equities firm, the story may be less about one correlation breaking and more about Bitcoin responding to a different lead market at different times of day.
A split between oil shock and risk appetite
The May 4 session gave the divergence a credible macro backdrop. The S&P 500 fell 0.4%, the Dow dropped 1.1%, and the Nasdaq slipped 0.2% as Brent crude settled 5.8% higher at $114.44.
The move came after renewed Middle East fighting threatened the Iran-war ceasefire and complicated U.S. efforts to reopen the Strait of Hormuz.
Crypto market context put Bitcoin in a different position from equities. Bitcoin trades near $80,743 on May 5, up more than 2% over 24 hours and more than 20% over 30 days.
The broader ranking table shows a crypto market worth about $2.67 trillion, with Bitcoin dominance near 60.6%.
Those numbers set the scale. A BTC move at that size is a market-wide signal, rather than an isolated altcoin rally.
When Bitcoin stops tracking SPY during an oil-and-rates shock, the question becomes whether a new buyer is present, whether older correlations are failing, or whether the market is digesting different sessions in sequence.
The first explanation is tempting because recent CryptoSlate coverage already showed a non-crypto driver in the move. Bitcoin's reclaim of $80,000 began as an Asia-led AI risk trade, with chip stocks and regional equity strength setting the tone before the U.S. session added oil, dollar, and yield pressure.

That sequence changes the interpretation. Bitcoin had one impulse driven by technology risk appetite and another by geopolitical repricing.
The visible break from SPY may have emerged because those impulses overlapped, rather than because BTC cleanly rejected equity-market logic.
This also explains why the morning reversal is part of the story rather than a contradiction to ignore. If U.S. futures can firm while BTC eases after oil cools, the market is signaling that Bitcoin's lead input may have changed.
The same chart can show a correlation break in one window and a different pressure channel in the next.
The oil channel turns one chart into a macro test
The Strait of Hormuz is large enough to make a chart pattern into a global macro question. Around 20.9 million barrels per day moved through the strait in the first half of 2025, equal to about 20% of global petroleum liquids consumption and one-quarter of maritime traded oil.
That is why the current market reaction extends beyond crude. A sustained Hormuz disruption changes expected fuel prices, inflation, central-bank flexibility, and the relative appeal of cash and bonds.
It also changes the way risk assets are valued.

The current shock is already large enough to change the macro map. The World Bank projected energy prices to surge 24% in 2026 and described the disruption as the largest oil supply shock on record.
Its April commodity outlook added a scenario range in which Brent could average $95 to $115 this year if the Middle East disruption proves more severe or more persistent than assumed.
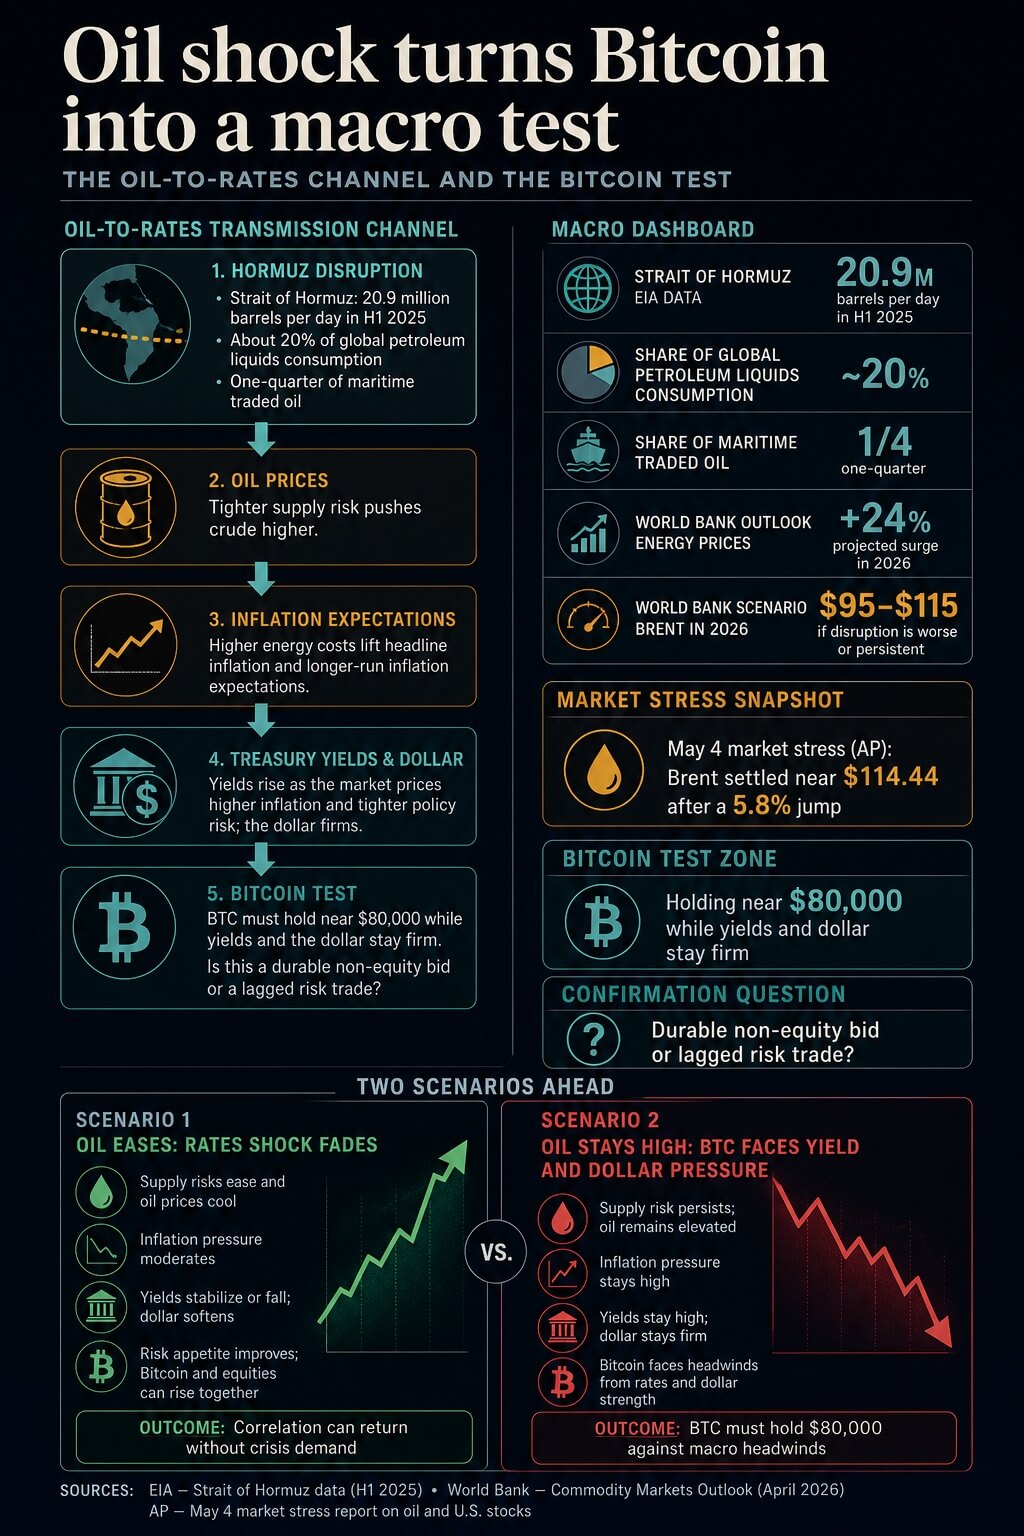
For Bitcoin, that creates two very different interpretations of the same price action. Holding $80,000 while oil and yields rise could signal a more durable macro bid.
It could also reflect a lag, with Asia-led risk appetite still supporting BTC before the U.S. rates channel fully hits.
The same oil shock can produce opposite BTC outcomes depending on which transmission line dominates. If investors treat Bitcoin as a liquid way to express fear of monetary disorder, it can catch a bid during inflation anxiety.
If investors treat it as a high-beta asset competing with cash and Treasuries, higher yields and a firmer dollar can work against it.
A prior CryptoSlate analysis framed Bitcoin as a fast market for repricing geopolitical risk, especially when headlines change the path for oil, inflation, rates, and liquidity expectations.
That frame still fits, but May 4 raises the bar. The earlier pattern was simple: escalation hurt, relief helped.
This time, BTC held up while several escalation-linked inputs moved in the wrong direction for risk assets.
That is where the second clock enters. The Asia-led AI trade gave Bitcoin a risk-on impulse before U.S. macro trading became dominant.
ETF wrappers and public-market BTC exposure also mean brokerage-account demand can move Bitcoin alongside the same portfolio screens that move AI equities. At the same time, the oil shock means bond traders are pulling BTC into an inflation and rates debate.
In Asia and Europe trading hours today, May 5, U.S. Treasury yields and the dollar firmed on crude strength while BTC held near $81,000 and Asian chip strength remained part of the risk backdrop.
The result is a market that appears uncorrelated in a single snapshot while still depending on external inputs.
Bitcoin may be following a different lead market first, then catching up to the next macro impulse later.

Â
| Signal | BTC implication | What would confirm the break |
|---|---|---|
| Oil stays above stress levels | Pressure shifts from geopolitics into inflation and rates | BTC holds even as yields and the dollar stay firm |
| Oil eases after Hormuz progress | The rates shock fades and risk appetite can reassert itself | BTC and equities rise together without needing crisis demand |
| AI and chip stocks keep leading | BTC may trade as a brokerage-account risk asset | BTC follows tech strength even when macro headlines are noisy |
| ETF flows and derivatives weaken | The move may be mostly positioning rather than durable demand | BTC loses the $80,000 area as macro pressure returns |
The next signal comes from several markets
The live geopolitical question is still Hormuz. The U.S. attempt to force open the strait was testing the fragile ceasefire on May 5, with Iran warning against the move and the U.S. saying two American-flagged merchant ships had transited.
If that effort succeeds and shipping normalizes, oil pressure should ease. That would likely reduce the rate shock and let Bitcoin trade more cleanly on ETF demand, technology risk appetite, and the $80,000 level itself.
If the reopening fails or retaliation escalates, the harder test begins. Bitcoin would need to hold up against a more persistent mix of high oil prices, a firm dollar, and elevated Treasury yields.
That would be stronger evidence that BTC has gained a non-equity bid, but even then, the evidence would need confirmation from ETF flows, derivatives positioning, and sustained price acceptance above the low-$80,000 area.
The correlation break carries weight because it suggests that a BTC holder may now be exposed to several macro engines simultaneously.
In one session, Bitcoin can behave like a tech-risk asset. In another, it can act like the fastest market for repricing war risk.
In a third, it can get pulled back into the bond-market math that still governs liquidity assets.
That is the real regime test. Bitcoin's stock link is becoming incomplete as oil, AI equities, ETF wrappers, the dollar, and Treasury yields all compete to set the next move.
The post Bitcoin rally breaks from US stock market as mixed macro data creates bullish setup for BTC appeared first on CryptoSlate.