Bitcoin price is exploding, and a rare “gamma squeeze†suggests the price action is about to get violent

Bitcoin's brief climb above $97,000 over the past day extended a run that suggests the underlying mechanics signal a structural shift in how capital is interacting with the asset class.
According to CryptoSlate data, BTC reached a peak of $97,860, its highest price level since last November. This price performance continues the flagship digital asset's strong start to the year, which has pulled the broader crypto market along.
However, the upward price movement was not occurring in a speculative vacuum. Instead, it is supported by key on-chain metrics that paint a picture of renewed institutional appetite clashing with a supply side that has suddenly stopped selling.
Here, CryptoSlate, citing on-chain data, explains why Bitcoin is currently in an uptrend.

Bitcoin's spot bid and whale dominance
The most direct driver behind the price appreciation was a sharp re-acceleration in US spot Bitcoin ETF inflows.
Data from Coinperps showed that the 12 Bitcoin ETF products have seen inflows of more than $1.5 billion in the last two days alone.
Those are not just big numbers because they matter mechanically.
Post-halving, Bitcoin’s new issuance is roughly 450 BTC per day. At current prices, this represents a relatively small dollar figure compared with the kind of demand implied by high-inflow ETF days.
ETF flows are not the only source of spot buying, and they do not map 1:1 to immediate “market buys†in every case. Yet, they are a highly visible, regulated conduit that can quickly pull incremental demand into the market.
This is particularly effective when institutional allocators rebalance or when broader “risk-on†flows return to financial markets.
This dynamic explains why ETF flow data has become a daily macro-like signal for the crypto sector. It helps explain why Bitcoin can rise even when crypto-native narratives are quiet.
Data from CryptoQuant reinforces this narrative of spot-led strength. According to the firm’s indicators, the move was not initially driven by leverage but by genuine demand for the underlying asset.
CryptoQuant’s 90-day Spot Taker CVD began turning positive around $86,000, signaling increased Taker Buy dominance. This metric indicates that market buy volume consistently outweighed sell volume well before the price reached its current highs.


Furthermore, the quality of this buying was distinct. Spot Average Order Size flashed “Whale Orders†during the same period. This indicates the buy volume was driven by larger entities rather than dispersed retail speculation.
These investors stepped in to take the lead in this rally through spot purchases rather than relying on fragile leverage.
Profit-taking slows
The second leg of the move is defined by the absence of a negative force: relentless profit-taking.
Glassnode’s recent market notes show realized profit falling sharply from the elevated levels seen earlier in the fourth quarter.
According to the firm, BTC's 7-day moving average of realized profit for long-term holders dropped to roughly $183.8 million per day. This is down significantly from levels above $1 billion per day in late 2025.
That matters because Bitcoin rallies do not only require buyers. They also require fewer eager sellers.
When profit-taking intensity fades, even moderate demand can push the price higher because the market is not constantly being “refilled†with distribution from holders locking in gains.
Notably, this reluctance to sell is further evidenced by the Value Days Destroyed (VDD) indicator. This metric calculates the number of days bitcoins remained inactive before being moved, weighted by the amount of BTC transferred.
A low value indicates that younger coins are being moved, while a high value indicates that older, long-held coins are being spent.
Currently, the VDD stands at approximately 0.53 as of January 2026, a historically low level. This suggests that the BTC being transferred on the network is relatively young, implying that older coins remain untouched.

Past cycles suggest that a rising Bitcoin price paired with a muted VDD reading signals a robust expansion. In this environment, incoming demand does not need to chew through a wall of structural selling, allowing bids to lift prices more efficiently.
Therefore, the current breakout above resistance is supported by the inactivity of long-term holders. This reinforces the idea that real market strength is driving the asset rather than a fragile rebound fueled by short-term speculation.
Derivatives as an accelerant
The third driver is a classic accelerant: derivatives positioning.
As Bitcoin pushed upward, crypto market coverage tracked a wave of short liquidations. These are forced buybacks by traders betting against the move. These events can create abrupt “air pockets†as stops are hit and liquidations cascade.
Indeed, data from Glassnode showed that the latest move triggered the largest short liquidation event since Oct. 10 across the top 500 cryptocurrencies.


However, beyond the headline liquidation tally, the more structural shift may have been what happened to options.
Glassnode also noted that the market saw its largest-ever options open interest reset around the late-December expiry, with open interest dropping from 579,258 BTC to 316,472 BTC. This represents a reduction of more than 45%.
For market observers, options open interest is critical because it can change how market makers hedge risk.
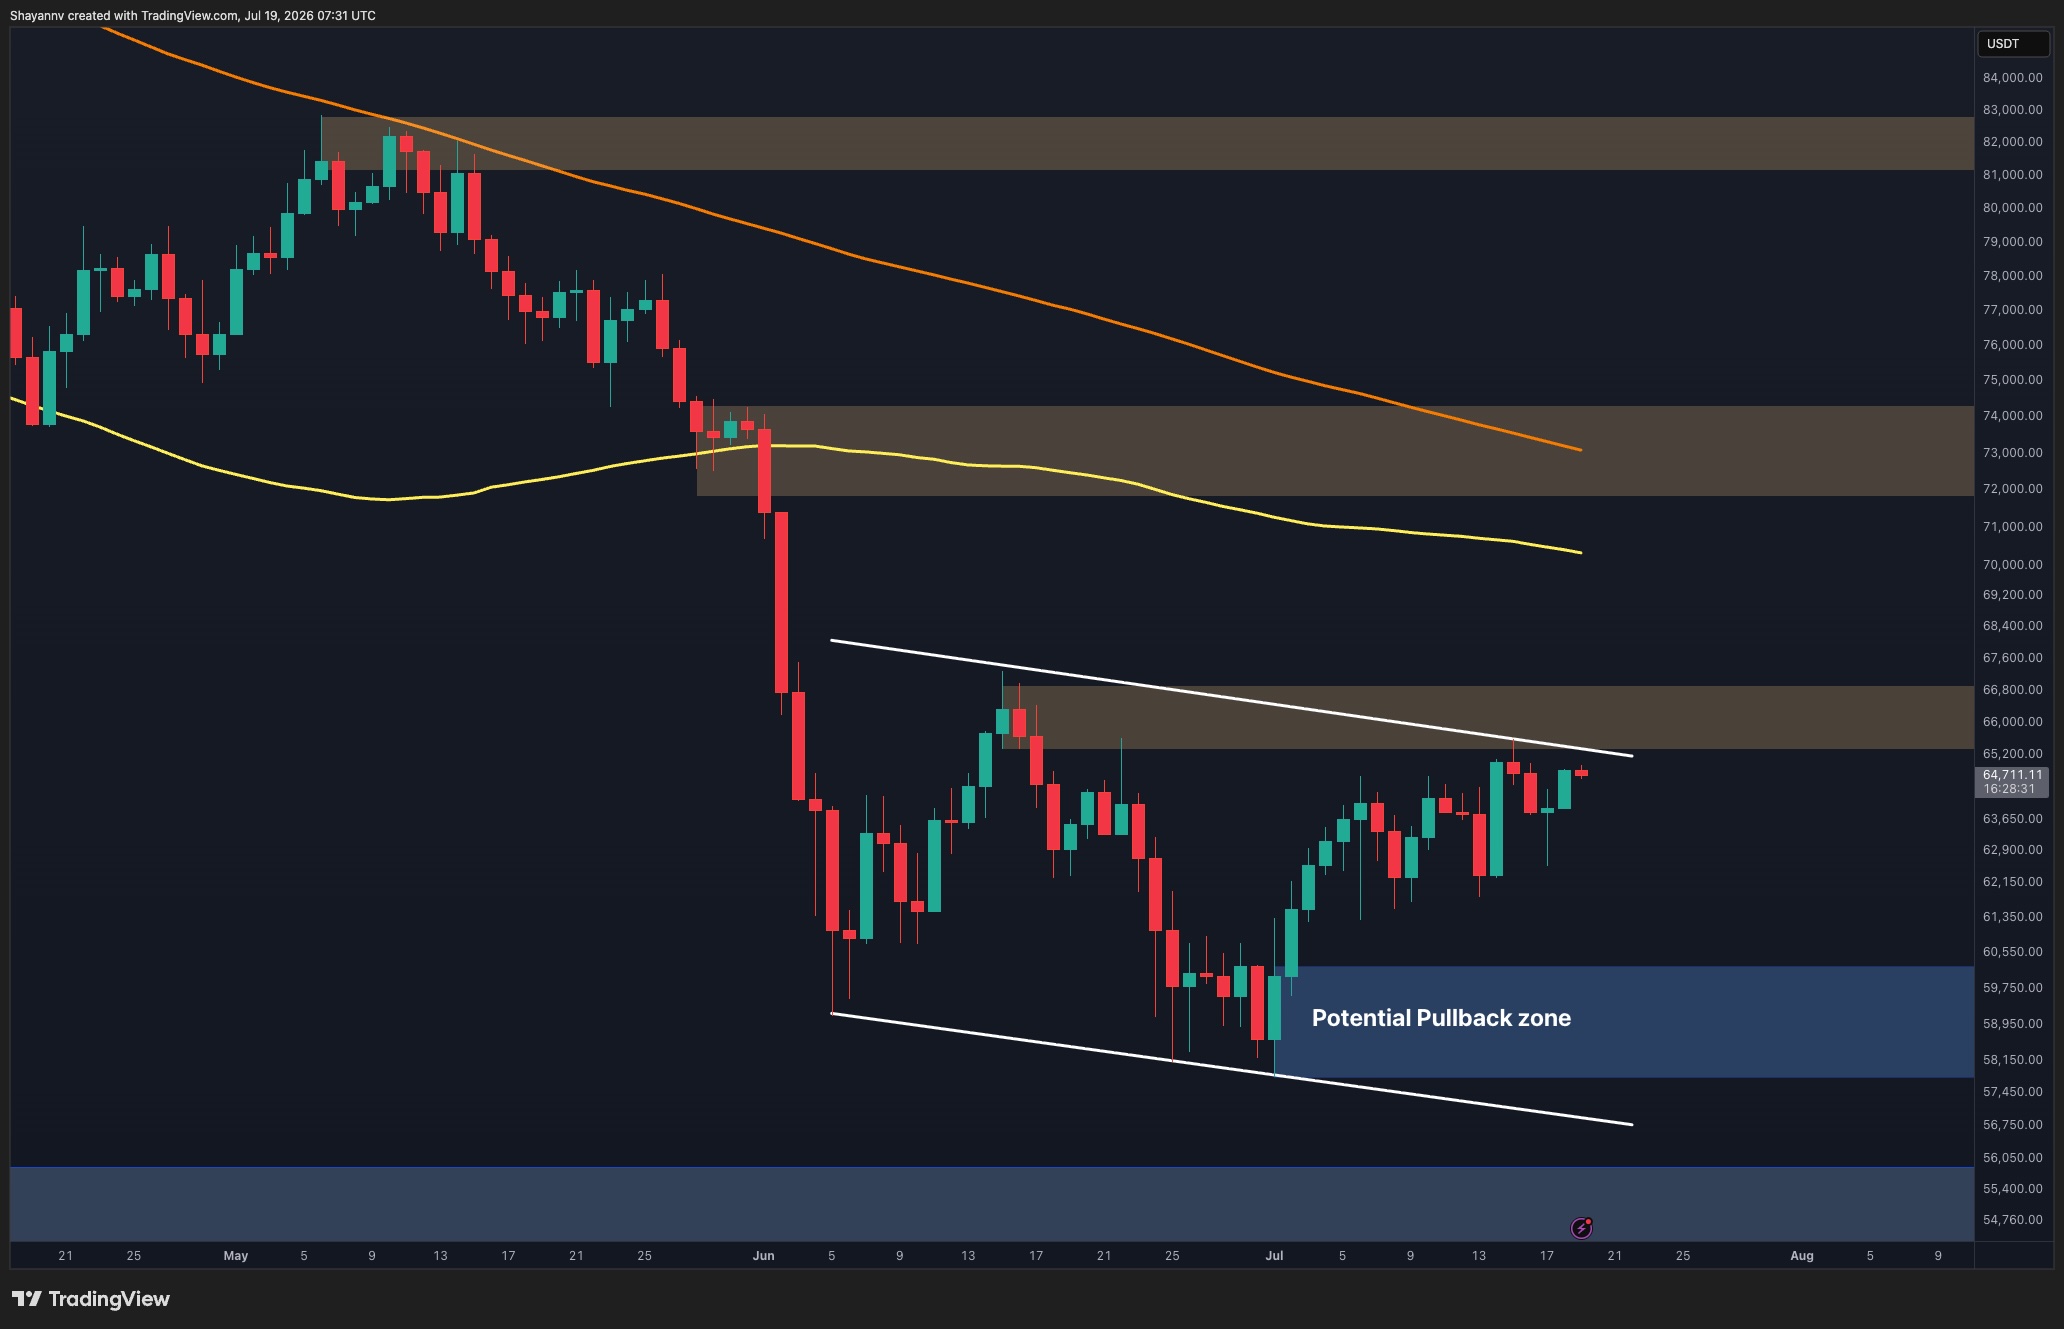
Glassnode also flagged that dealer gamma was short in the ~$95,000–$104,000 zone. This setup can amplify upside once price begins rising, as hedging flows align with the move rather than dampen it.
Put simply, the rally not only attracted new buyers. It also forced buying (through liquidations and hedging behavior) once key levels were challenged.
Meanwhile, CryptoQuant data confirms that futures participation arrived later in the sequence and was dominated by retail activity.
According to the firm, BTC's Futures Taker Buy Volume turned positive around $91,400, which was a bit later than the spot bid.
Still, it aligned with the top crypto's upward trend and confirmed the market's strength.
Macro and policy tailwinds
Bitcoin does not trade in a vacuum, and macro inputs offered a friendlier backdrop this week.
The latest US CPI release showed headline inflation at 2.7% year-over-year in December, with core CPI at 2.6% year-over-year. On a monthly basis, headline CPI was 0.3% (seasonally adjusted).
Markets often translate this into a simple question: Does inflation pressure keep real yields elevated and financial conditions tight, or does it allow risk appetite to expand?
Real yields remain historically meaningful (around 1.83% on the US 10-year TIPS yield in recent readings), but a softer inflation impulse can reduce the odds of further tightening shocks and help high-beta assets.
Bitcoin’s sensitivity to macro varies by regime. However, in periods where crypto trades as a “risk-on†proxy, less inflation anxiety can be enough to support a rebound, especially when spot flows and positioning align.
Meanwhile, a quieter contributor is the evolving US policy conversation around crypto market structure.
US lawmakers frame the CLARITY Act as an important piece of legislation that creates clearer boundaries between agencies and reduces “regulation-by-enforcement†dynamics.
While the legislation has drawn different reactions from market stakeholders, industry players agree that the bill could be positive for BTC by creating a friendlier regime that compresses the risk premium.

Can Bitcoin continue the run?
The question now is whether Bitcoin can convert this rebound into sustained upward momentum.
Glassnode highlights the Short-Term Holder (STH) cost basis around ~$99,100 as a key threshold. The logic is simple. When recent buyers are at breakeven or profit, they are less likely to sell defensively on small pullbacks, and momentum traders gain confidence.

At the same time, Bitcoin is entering an overhead supply zone where many buyers’ cost bases cluster. Glassnode flags a broad overhead range of roughly $92,100 to $117,400.
This implies that as price moves higher, it may repeatedly encounter cohorts eager to sell into strength near breakeven.
That creates two plausible paths. In a continuation scenario, if ETF inflows remain consistently positive and the price reclaims ~$99,000, the market can grind higher through supply as sellers are absorbed (especially if derivatives hedging remains supportive).
In a failure scenario, if price repeatedly rejects below the STH cost basis and macro turns tighter via higher real yields, the move risks looking like another range rally that exhausts as overhead supply reappears.
The post Bitcoin price is exploding, and a rare “gamma squeeze†suggests the price action is about to get violent appeared first on CryptoSlate.