
Ethereum Price Analysis: Can ETH Finally Break the $2,400 Resistance?
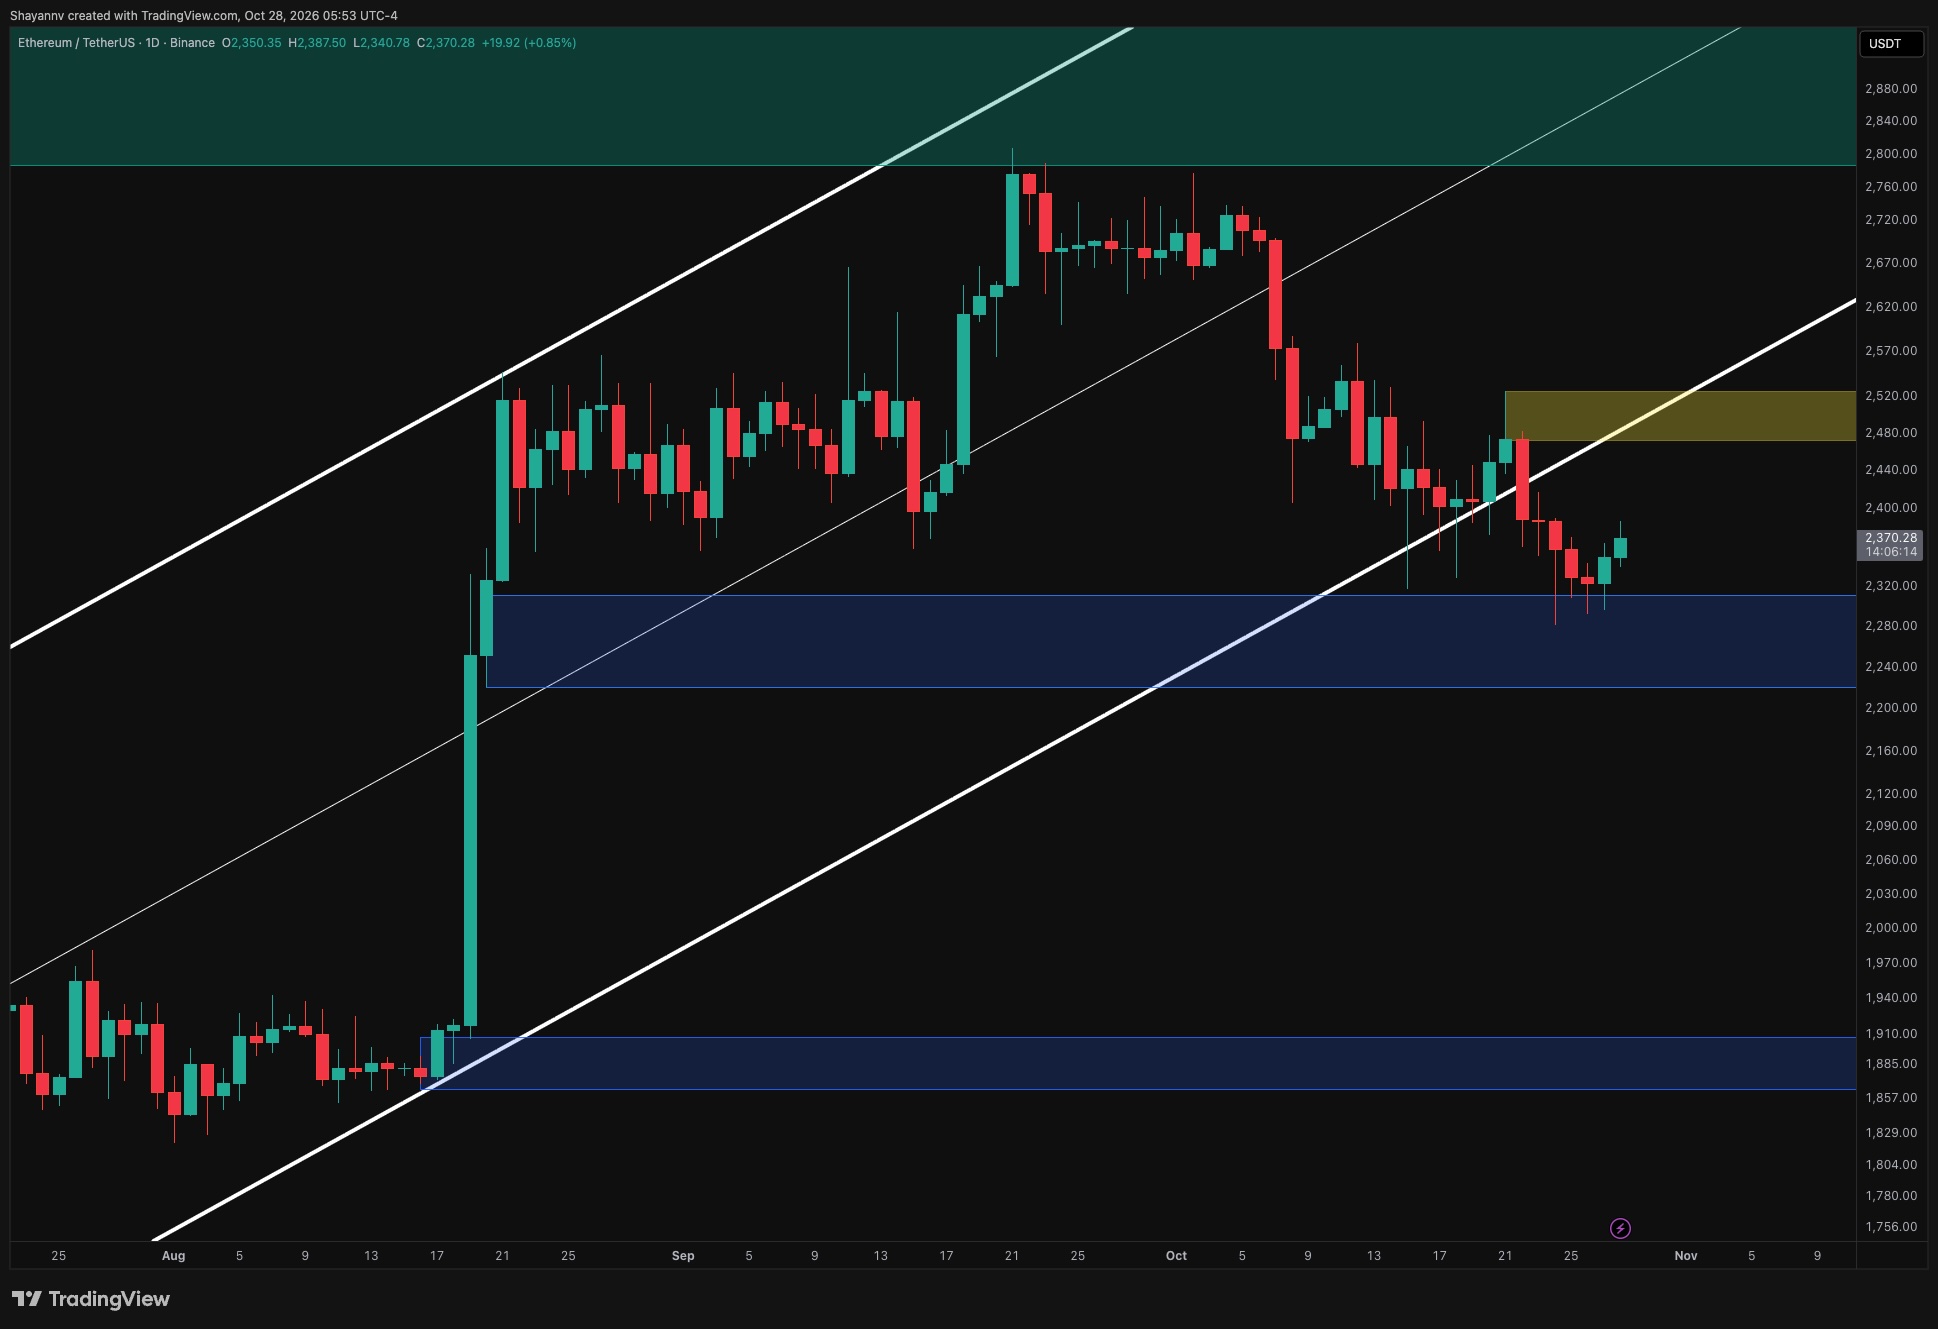
Ethereum has rebounded toward $2.37K after finding demand near $2.3K, but the recovery remains below its broken ascending channel. Buyers are showing an initial response, while the broader sequence of lower highs keeps the outlook cautious.
Ethereum Price Analysis: The Daily Chart
On the daily timeframe, Ethereum’s correction extended into the highlighted $2.22K–$2.31K demand zone before producing consecutive recovery candles. The rebound suggests that buyers are defending the upper portion of this region, although it has yet to reverse the bearish structure established after September’s peak.
ETH remains beneath the ascending channel’s former lower boundary, which now represents potential resistance. The marked $2.47K–$2.52K supply zone overlaps with this broken structure, creating an important obstacle to a sustained recovery.
Holding above $2.31K could support a further rebound toward $2.4K–$2.44K and subsequently the supply zone. However, until Ethereum reclaims $2.47K–$2.52K and the channel boundary, the advance appears corrective. Renewed weakness beneath the recent low around $2.28K would expose deeper support within the demand zone toward $2.22K.
ETH/USDT 4-Hour Chart
The 4-hour chart shows Ethereum recovering within a descending channel after consolidating around $2.3K. Recent candles have formed a short sequence of higher lows, carrying the price toward $2.37K, but the broader downtrend remains intact.
The immediate resistance area sits around $2.39K–$2.42K, where previous consolidation could attract renewed selling. Clearing this region would bring the descending channel’s upper boundary around $2.46K–$2.48K into focus. Its overlap with the $2.47K–$2.52K supply zone makes this a particularly significant test for buyers.
Conversely, a rejection followed by a loss of the recent $2.33K–$2.35K recovery base would increase the risk of another visit to the highlighted $2.27K–$2.31K support zone. A sustained breakdown beneath $2.27K would favor continuation toward the lower portion of daily demand near $2.22K.

Sentiment Analysis
The two-week Binance ETH/USDT liquidation heatmap highlights nearby estimated liquidation concentrations above the recovering price. Bands around $2.39K–$2.4K and $2.43K–$2.44K could become relevant if the rebound continues, while a broader concentration remains around $2.52K–$2.55K.
The $2.43K–$2.44K cluster sits below the main technical supply zone. A move through it could trigger short liquidations and accelerate the rebound toward descending resistance. However, such an acceleration would not independently confirm a broader bullish reversal.
Below price, a prominent liquidation band remains around $2.27K–$2.29K, with additional concentrations extending toward $2.22K–$2.25K. Losing the recent recovery structure could bring these pools back into focus, potentially amplifying a decline through long liquidations. For now, the heatmap supports the possibility of a short-term liquidity-driven rebound, while the technical trend remains bearish beneath overhead supply.

The post Ethereum Price Analysis: Can ETH Finally Break the $2,400 Resistance? appeared first on CryptoPotato.