
Ethereum Price Prediction: ETH Battles 100-Day MA as $2K Support Holds the Key

Ethereum is trading at $2,120 as the final week of May begins, caught in a tug-of-war with the 100-day MA that encapsulates everything frustrating about this cycle.
Having briefly reclaimed the moving average in late April for the first time since the correction began, ETH surrendered it again during the May breakdown and is now trading just below it.
Yet, the moving average is close enough that a single strong daily close could flip the script, but it has been unable to do so with the momentum currently available.
The next few days will determine whether that reclaim sticks or the key $1.8K demand zone finally becomes the next topic of conversation.
Ethereum Price Analysis: The Daily Chart
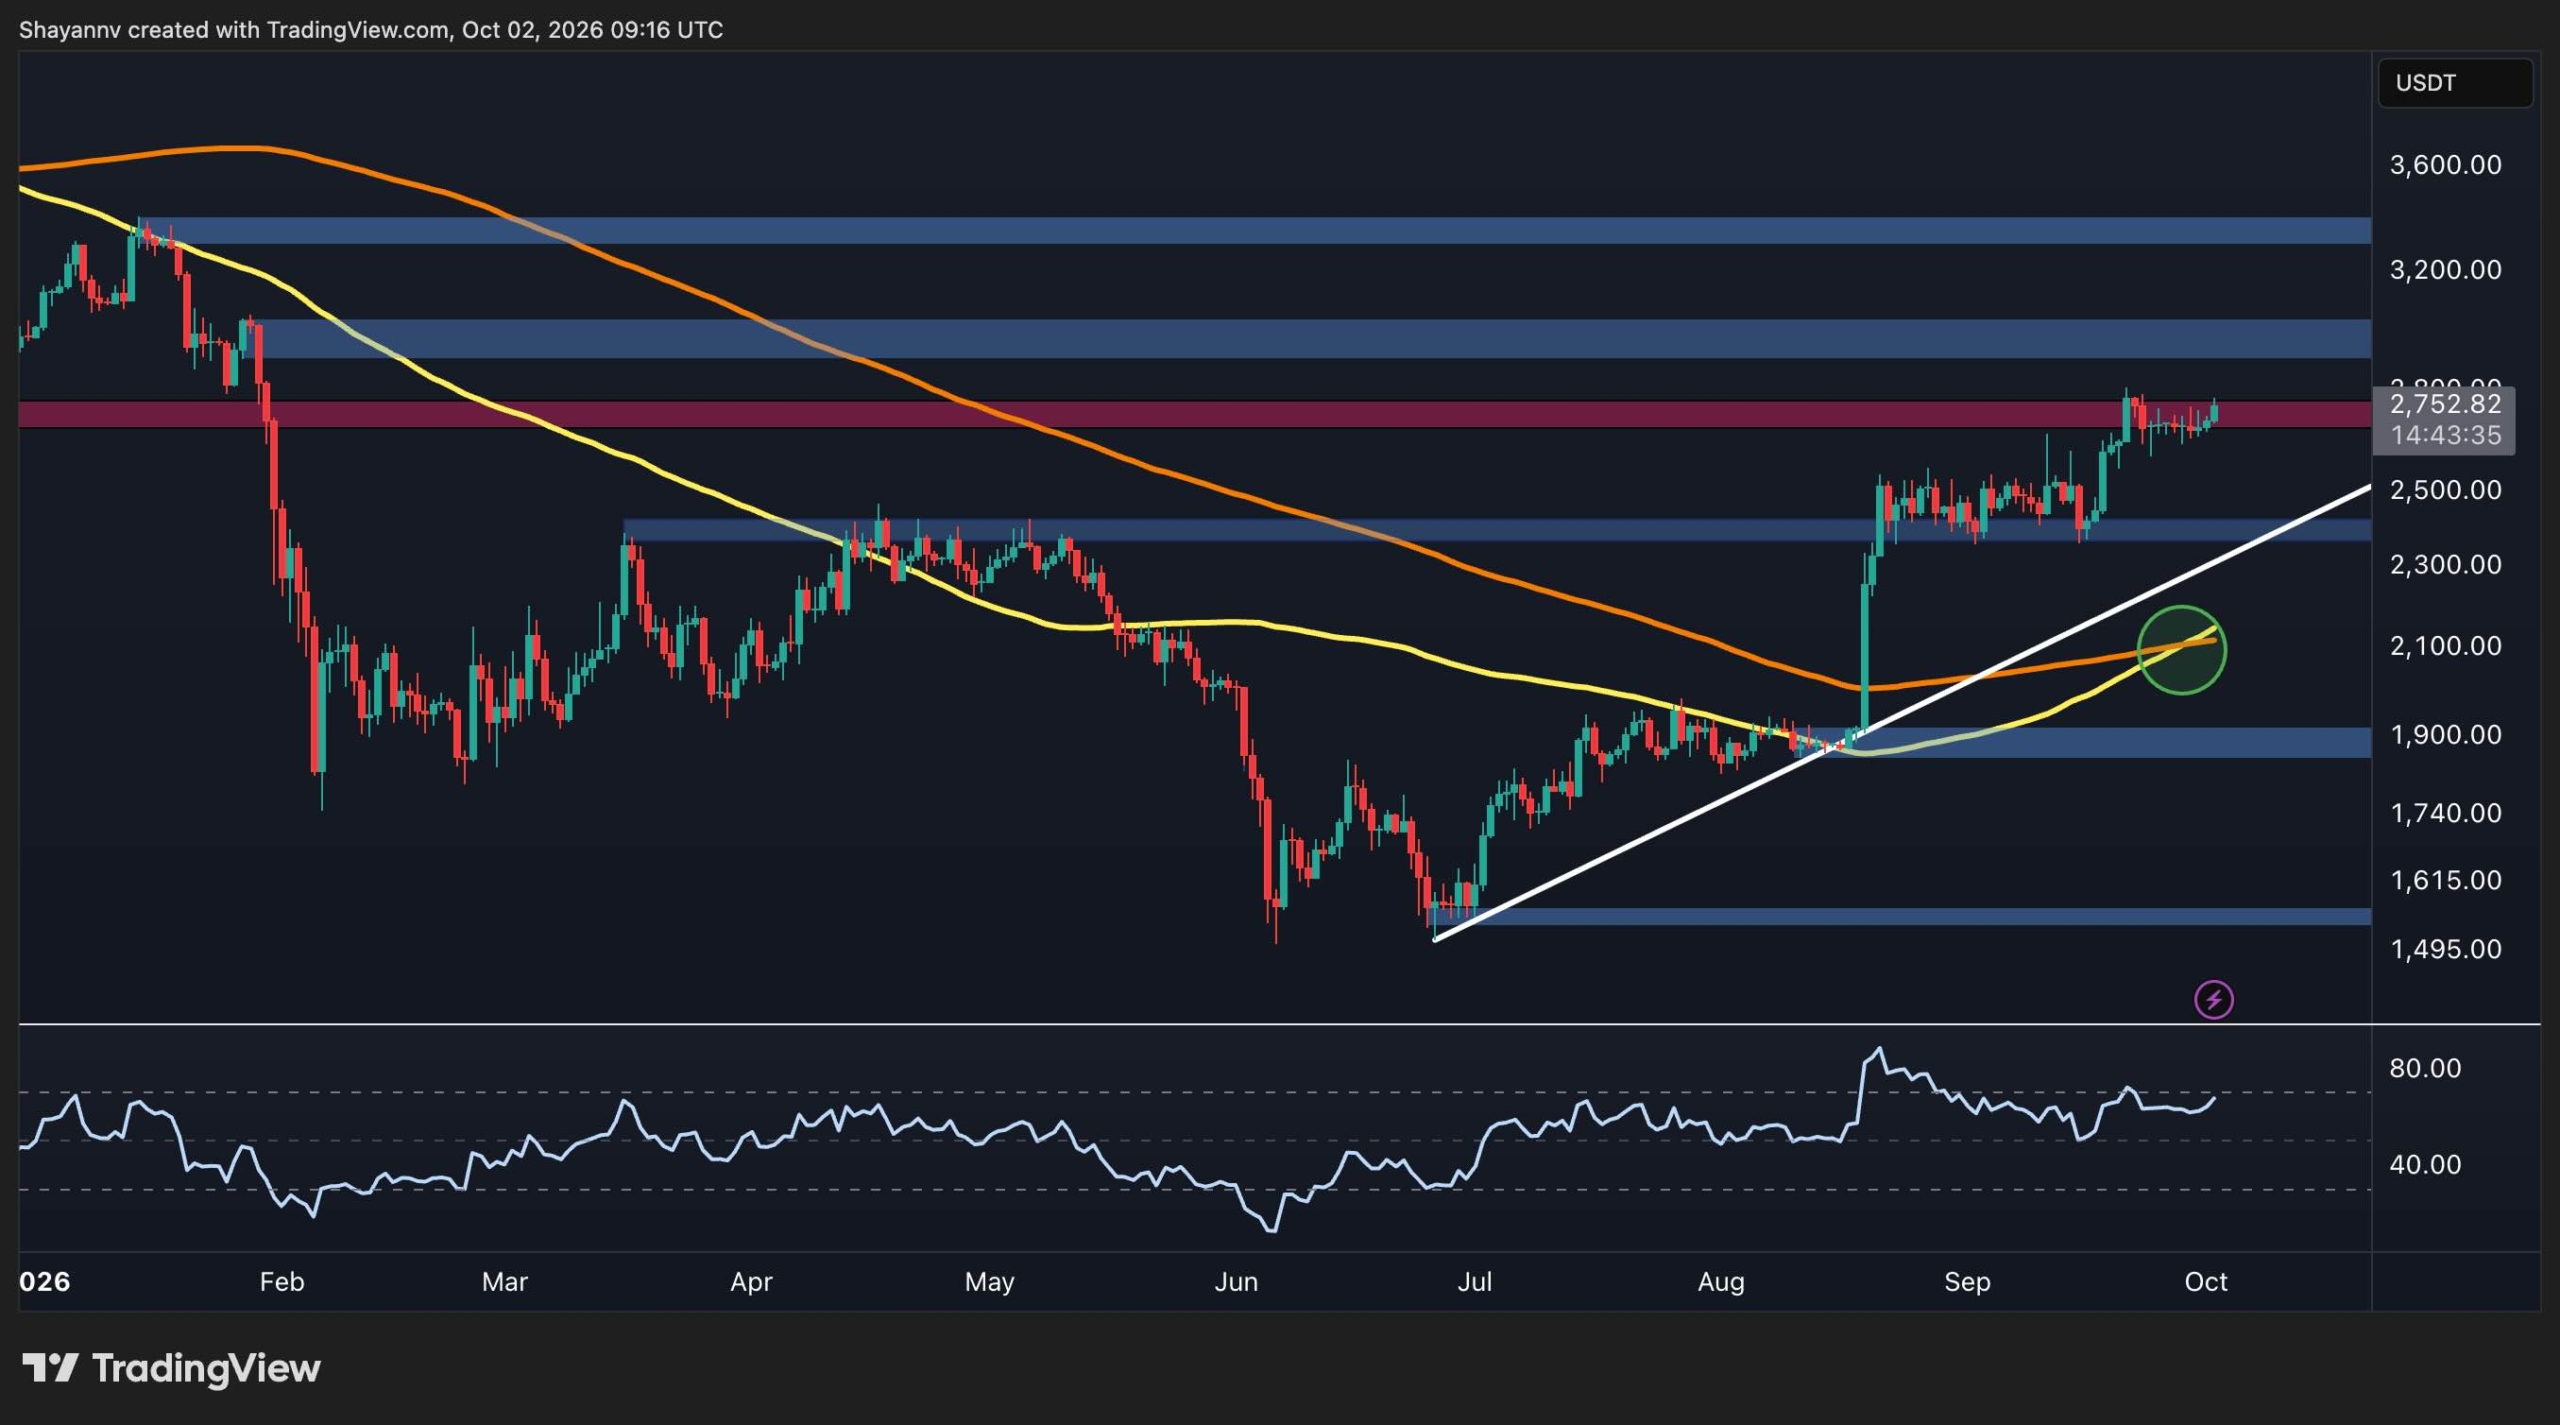
On the daily chart, it is evident that ETH briefly reclaimed the declining 100-day moving average in late April, only to lose it again during the May breakdown. The price is now trading just below it at approximately $2.1K, with the 100-day moving average sitting a short distance overhead and acting as resistance once more rather than support.
The RSI has also recovered from its low last week near 30 to approximately 40, which is a modest bounce with no directional conviction yet.
The dynamic has shifted subtly but meaningfully, as this is no longer a case of the 100-day MA sitting far above as an aspirational target. It is close enough to touch, and the daily closes around $2.1K represent an ongoing battle to reclaim it.
A sustained close above the moving average and the $2.2k level would confirm the reclaim and shift the structure back toward neutral. On the other hand, a close below $2,000 would simultaneously breach the ascending channel’s lower boundary, leaving $1.8k as the only remaining structural support before a full reassessment of the recovery thesis.

ETH/USDT 4-Hour Chart
The 4-hour chart shows the price compressing into an increasingly tight range between the $2k support zone below and the $2.15k area overhead. The RSI is recovering from oversold territory to just above 50, which is enough to stabilize the market without yet generating upside momentum.
The white ascending channel’s lower boundary at $2.08k converges with the lower boundary of the $2.15k resistance zone, making that band the last technical defense before $1.8k.
The first meaningful target above is the $2.25k zone, which is the level that acted as support through most of April and early May before the breakdown.
A 4-hour close back above it would signal that the worst of the selling pressure has passed and open a path toward $2.4k. Until that reclaim happens, the tight range between $2.15k and $2k is likely to continue as the market waits for a catalyst in either direction.

Sentiment Analysis
ETH’s funding rate has been predominantly positive throughout most of the corrective phase, with only brief negative spikes rather than the sustained red dominance.
The notable exception was late April, when funding tilted mostly negative for an extended stretch, which coincided with the period where price stalled repeatedly at $2.4k and eventually broke down.
That negative phase appears to have cleared, as funding has returned to positive and has recently printed some of the higher green readings of the past two to three months. The current reading of +0.005 sits at the upper end of what has been a muted range.
The timing of this shift matters. Funding turning aggressively positive while price is sitting at $2.1k, closer to the multi-month lows than to resistance, suggests that a fresh cohort of longs is building positions at current levels with conviction rather than chasing a breakout.
The current setup is more structurally sound, as longs are accumulating near support rather than at the ceiling. Whether that conviction is rewarded depends entirely on whether the $2k channel floor holds and the 100-day moving average is reclaimed again.
-

Source: TradingView
The post Ethereum Price Prediction: ETH Battles 100-Day MA as $2K Support Holds the Key appeared first on CryptoPotato.