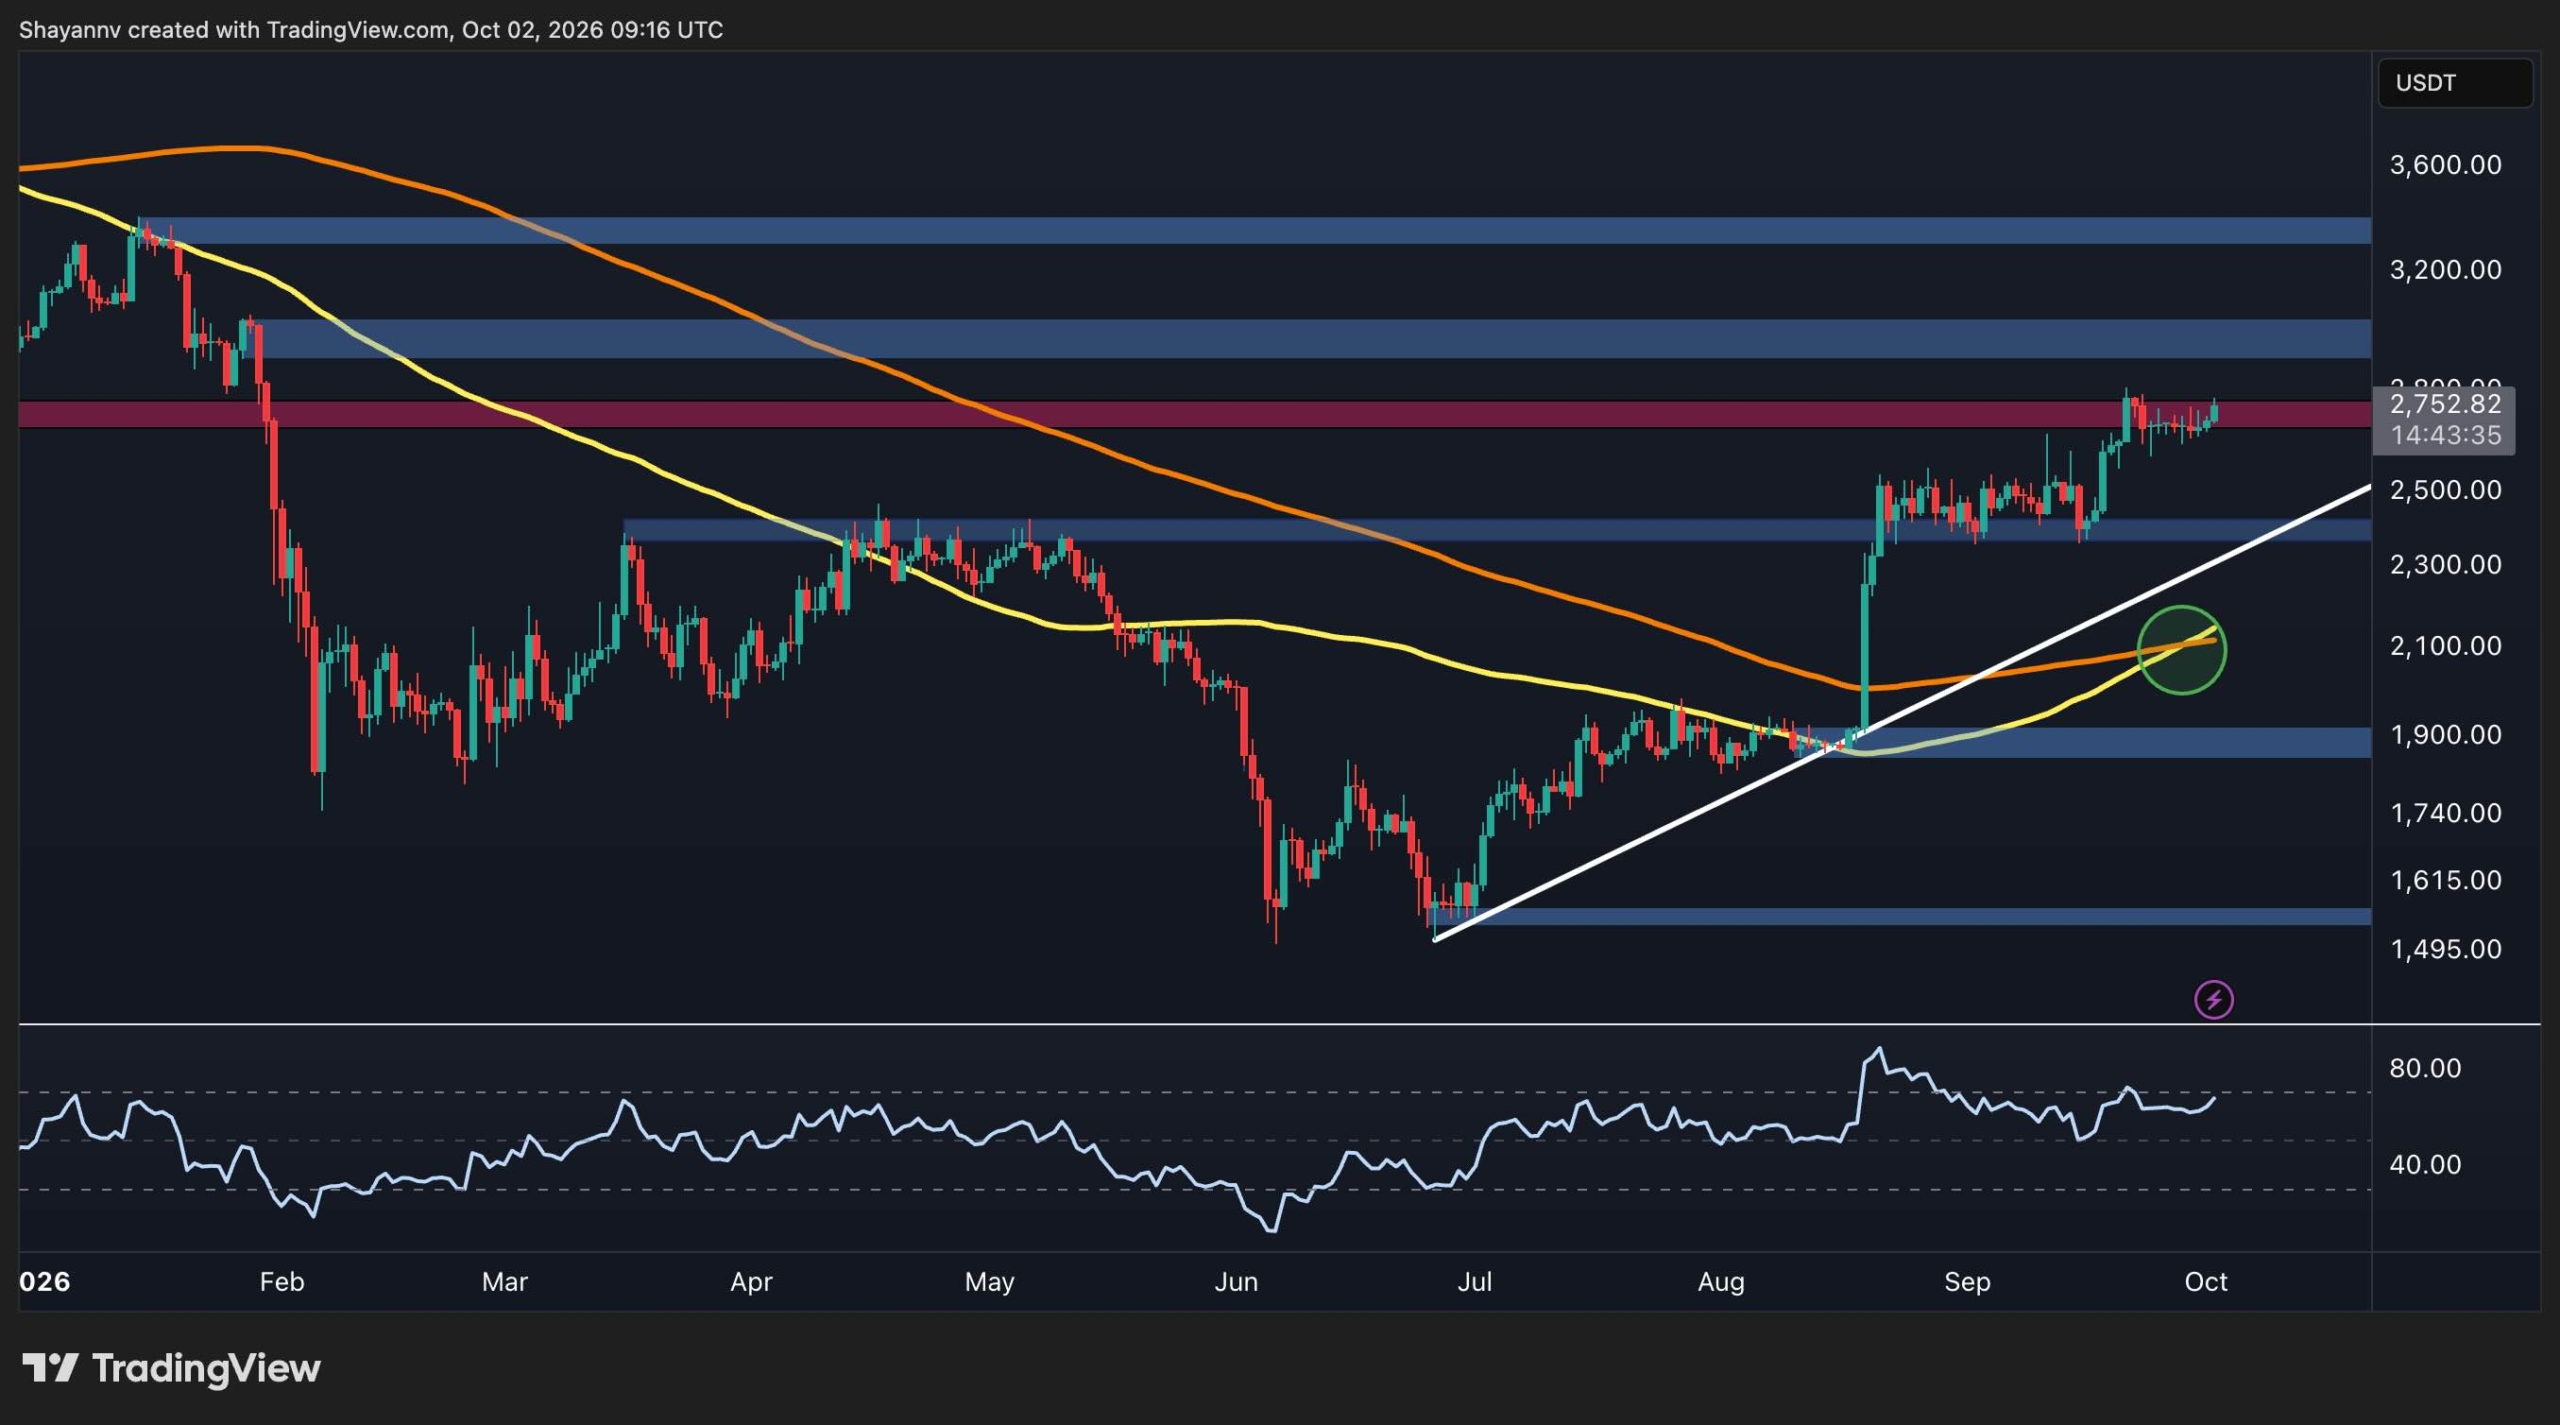

Ethereum Price Prediction: Relief Rally or Another ETH Dump Next?
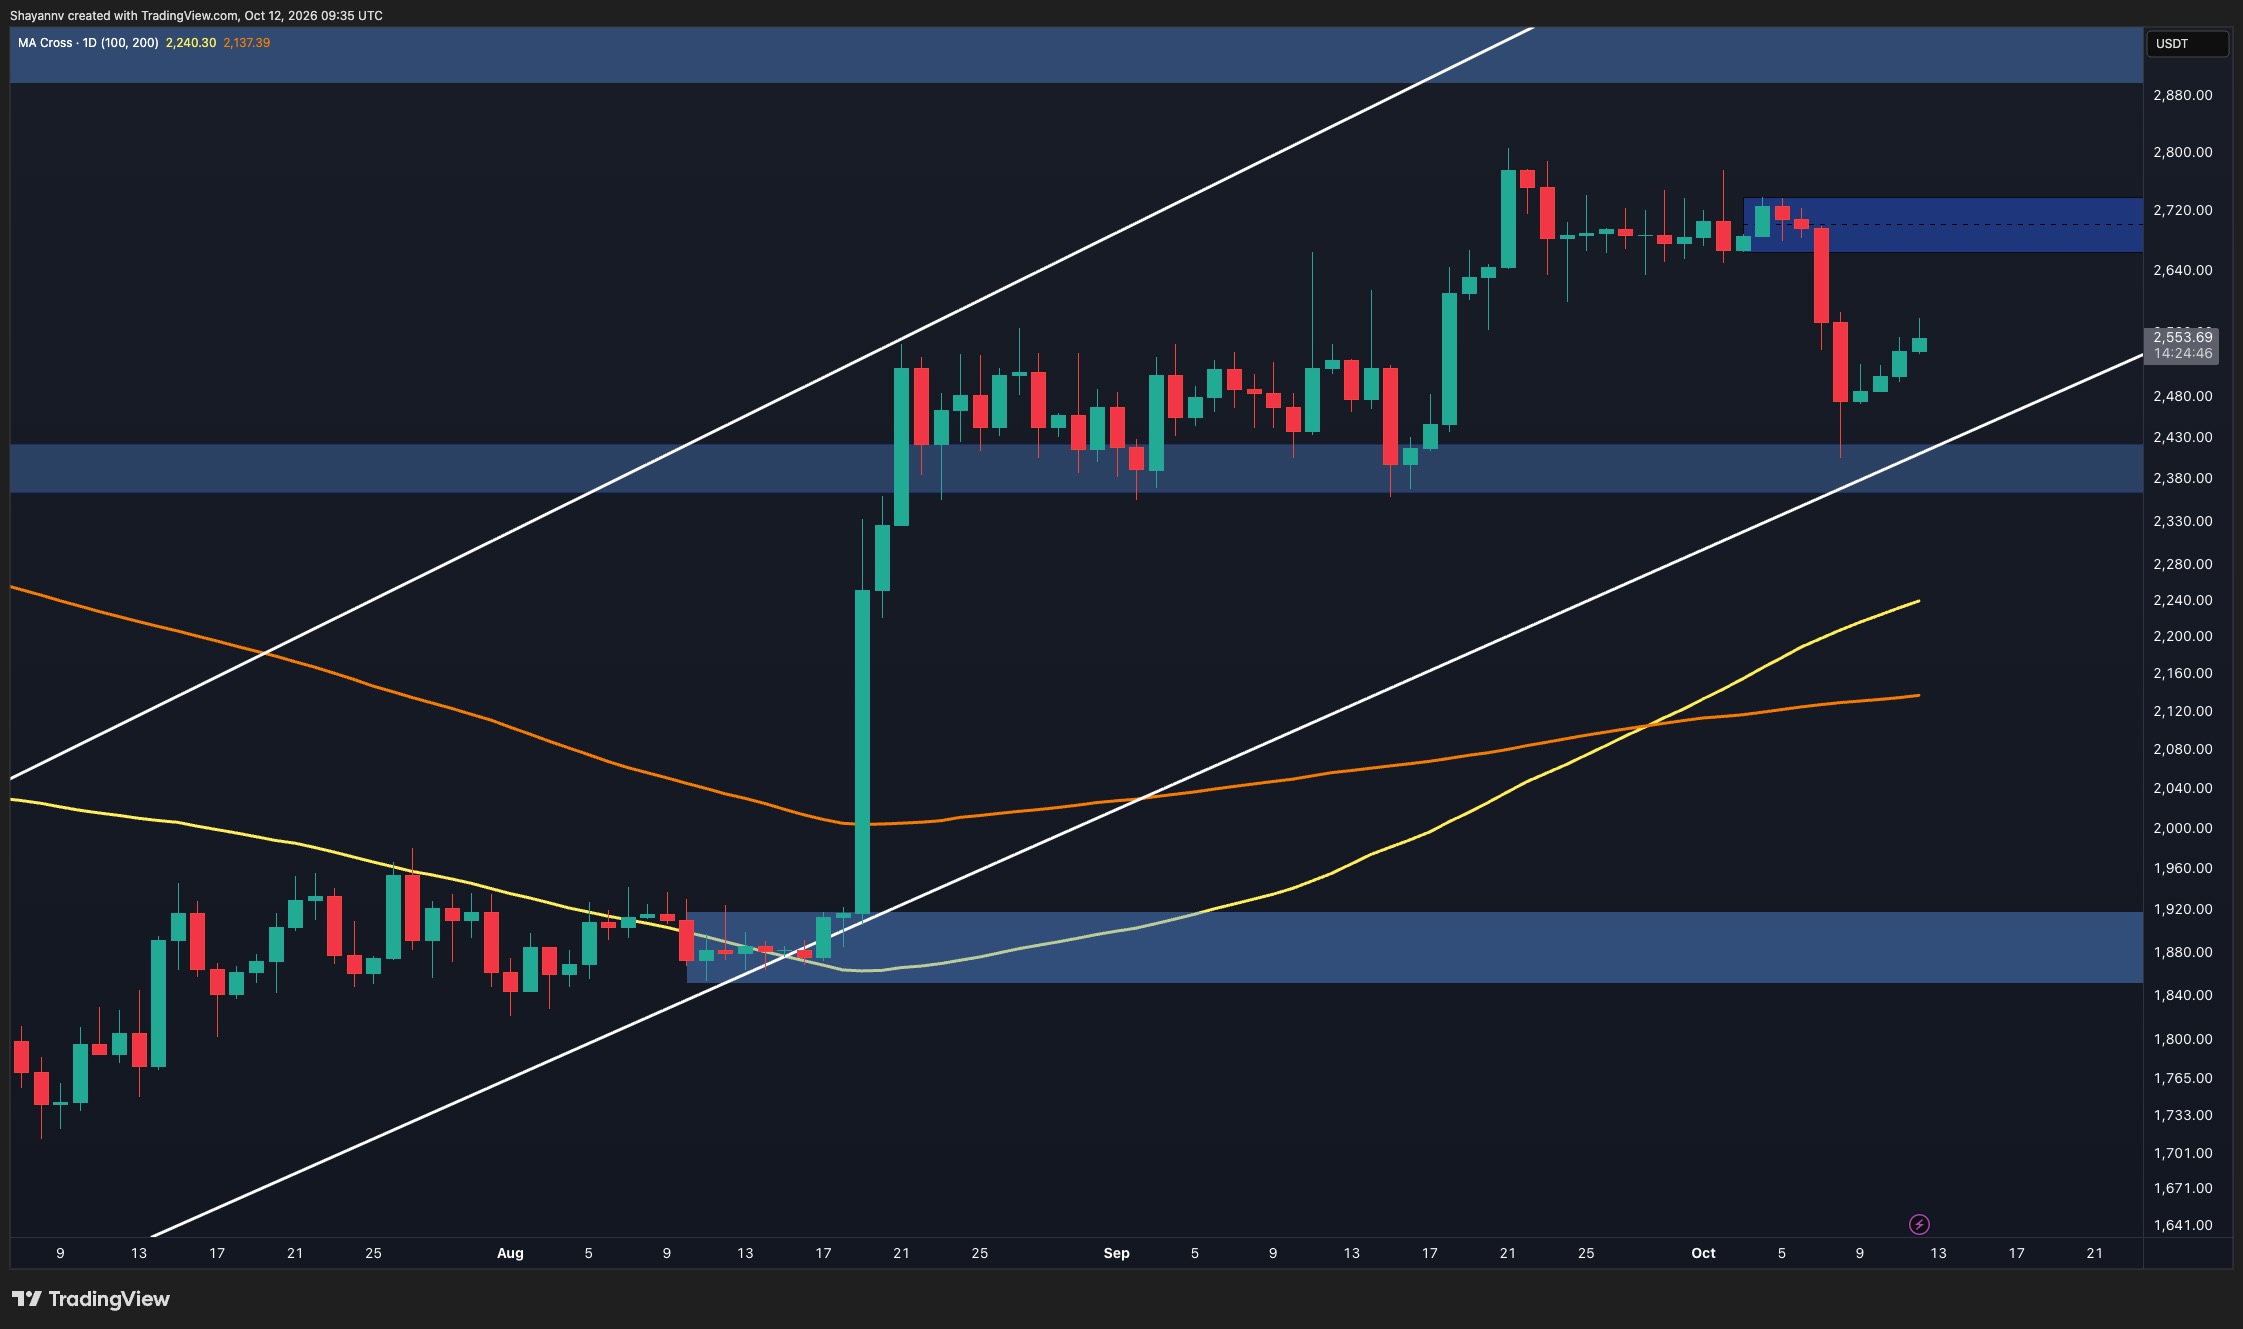
Ethereum is recovering toward $2.55K after buyers responded to the latest selloff near a key demand area. The rebound preserves the broader ascending structure, but ETH still needs to reclaim overhead supply to demonstrate a more durable recovery.
Ethereum Price Analysis: The Daily Chart
On the daily timeframe, Ethereum’s correction extended into the $2.36K–$2.42K demand zone before producing a notable lower wick and several recovery candles. The price has since climbed toward $2.55K, suggesting that buyers are defending the region following the sharp decline from the recent consolidation.
ETH also remains within the broader ascending channel and above both major moving averages. The 100-day average sits near $2.24K, above the 200-day average around $2.14K, maintaining the bullish crossover established earlier. However, this supportive backdrop has yet to translate into a recovery of the lost resistance levels.
The highlighted $2.66K–$2.74K supply zone represents the main nearby barrier. Reclaiming this area would strengthen the recovery scenario and allow another challenge of the recent $2.8K high, followed by the $2.9K–$3K resistance region.
Conversely, renewed selling would bring the $2.36K–$2.42K demand zone and nearby channel support back into focus. A sustained break below this confluence would weaken the broader structure and expose the moving-average region around $2.14K–$2.24K.
ETH/USDT 4-Hour Chart
The 4-hour chart shows Ethereum rebounding after briefly piercing the $2.43K–$2.48K demand zone and the lower ascending trendline. The subsequent recovery above both suggests rejection of lower prices, although the earlier selloff has left ETH trading beneath the rising structure’s middle trendline.
Holding the reclaimed trendline around $2.49K–$2.5K would support a continuation of the rebound toward the $2.6K area. Beyond that, the $2.66K–$2.74K supply zone overlaps with the broken middle trendline, creating an important resistance confluence where sellers could reappear.
Until Ethereum clears that region, the advance remains a recovery within a weakened short-term structure. Losing $2.49K would increase the likelihood of another test of the $2.43K–$2.48K demand zone. A decisive breakdown below the recent wick low around $2.4K could then expose the next highlighted support area at $2.22K–$2.28K.

Sentiment Analysis
The Ethereum Spot Average Order Size chart classifies spot activity by average trade size, distinguishing normal orders from retail-sized and whale-sized activity. It provides context for participant size, although it does not independently identify whether larger traders are buying or selling.
The latest observations remain predominantly in the normal-order category, including the recent advance toward $2.7K and the subsequent correction toward $2.5K. This contrasts with the frequent whale-sized readings visible during earlier periods, particularly around the June–August price base.
Consequently, the current rebound is not accompanied by a visible return of whale-sized average orders. This does not establish that large investors are absent or that the recovery must fail, but the metric offers limited confirmation of renewed large-order participation. A shift toward whale-sized readings alongside a sustained price recovery would provide additional context, while buying direction would still need confirmation from other data.

The post Ethereum Price Prediction: Relief Rally or Another ETH Dump Next? appeared first on CryptoPotato.