
Bitcoin Price Analysis: Key Support Levels and Liquidity Clusters to Watch This Week
Bitcoin is attempting to recover after its latest rejection from the $86K-$87.3K supply area. While the broader structure remains constructive, BTC still needs to reclaim this overhead zone to confirm another leg higher, with liquidity positioned on both sides of the market.
Bitcoin Price Analysis: The Daily Chart
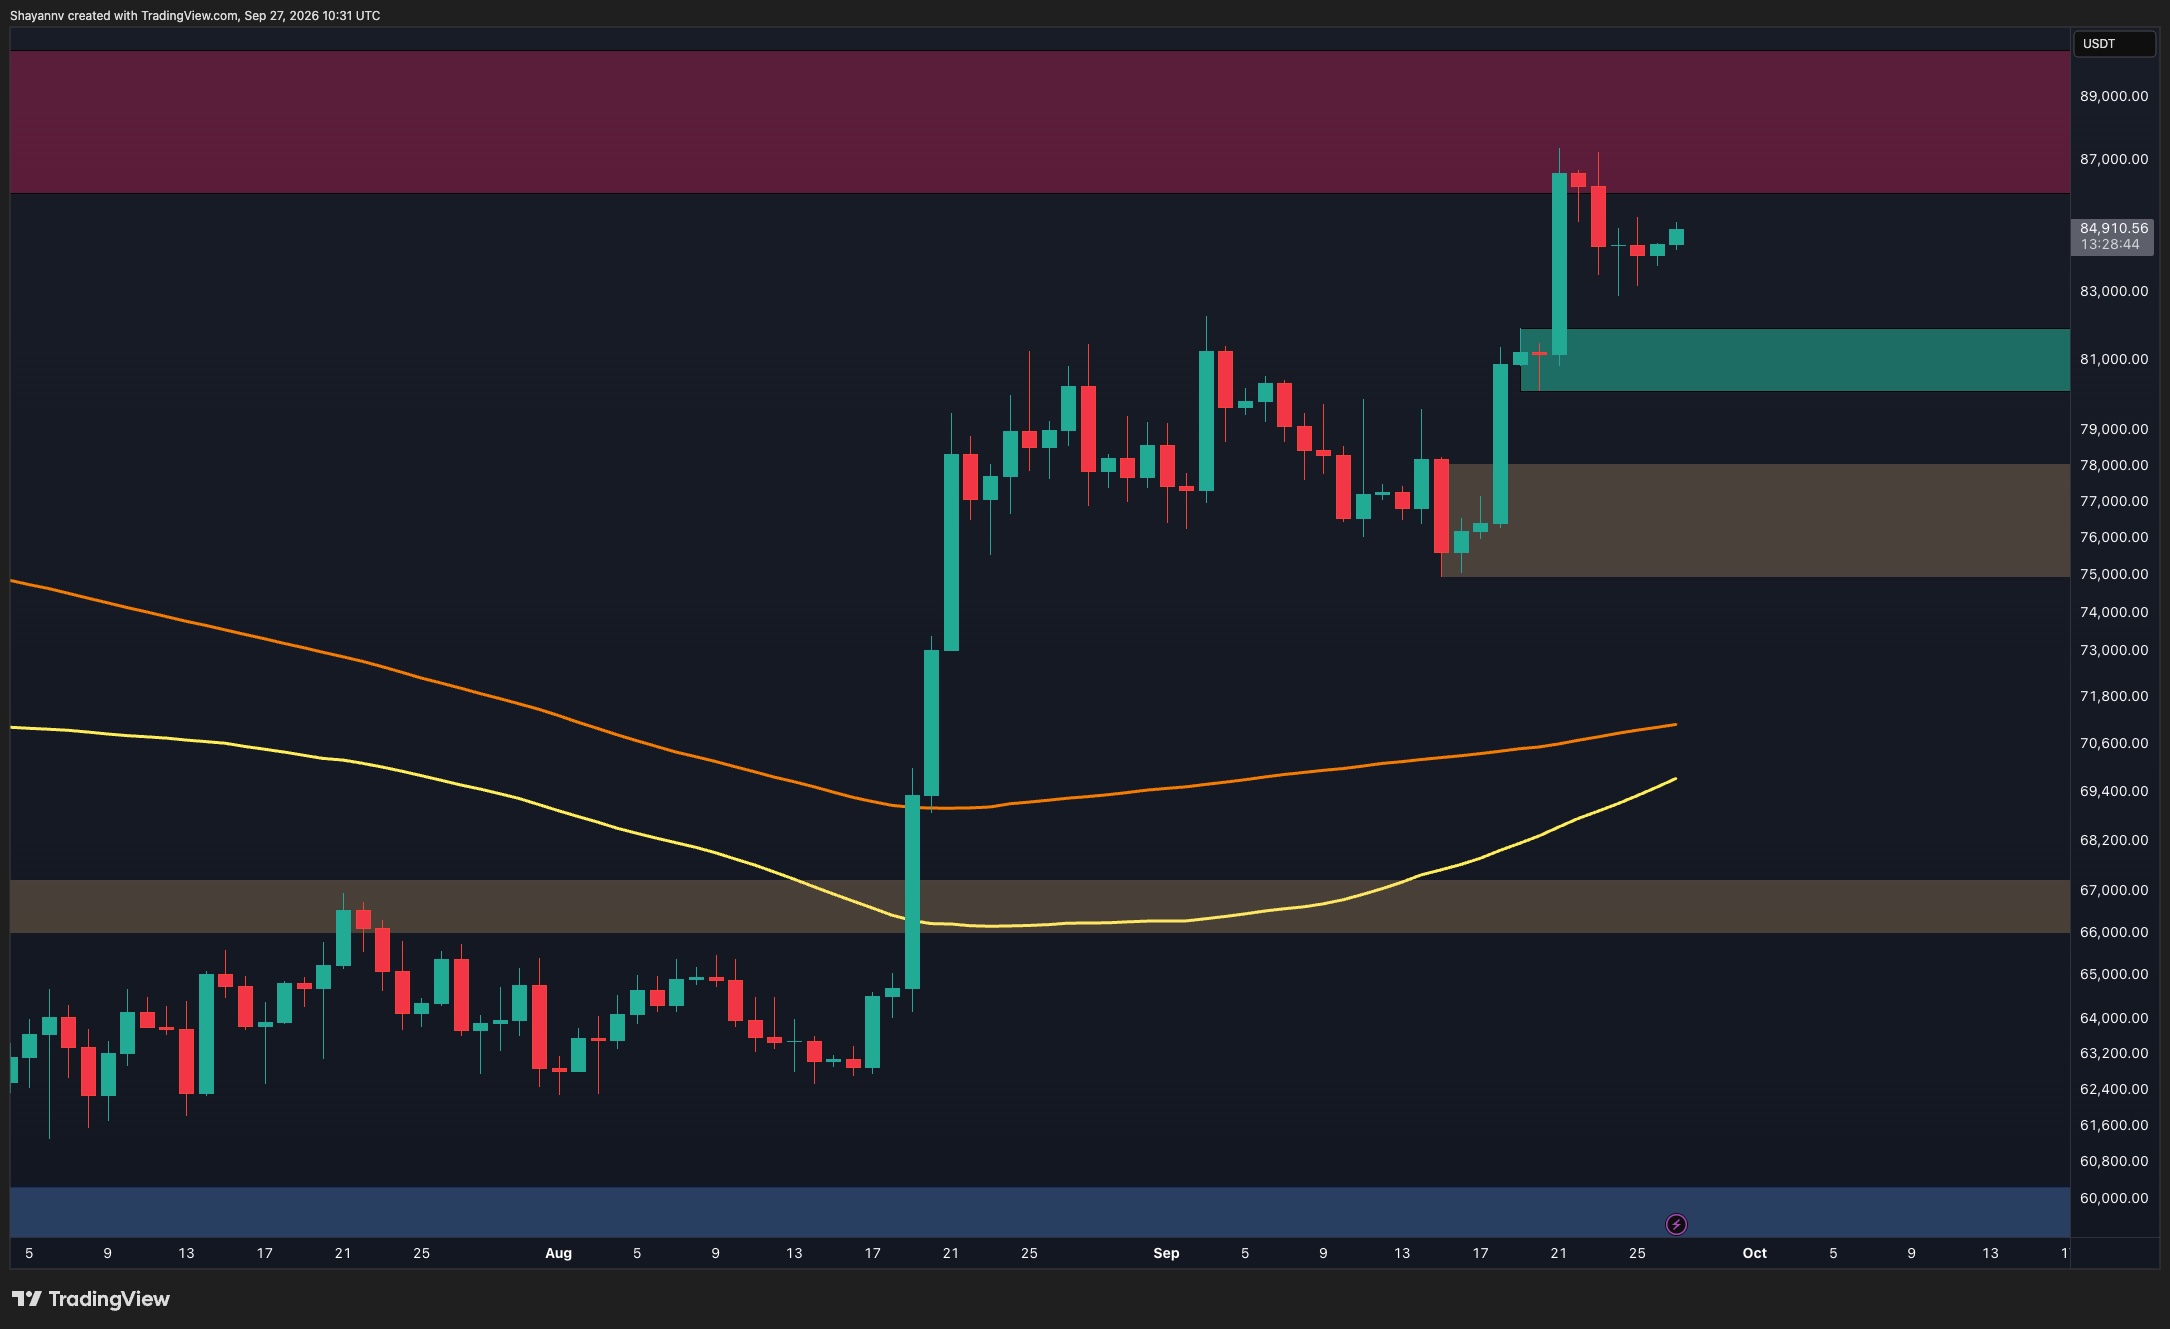
On the daily timeframe, Bitcoin remains in a bullish market structure following the powerful August breakout. The price has since established itself well above both displayed moving averages, which are now turning higher and providing a more supportive medium-term backdrop.
The latest advance carried BTC into the major $86K-$89K resistance region, where sellers stepped in and triggered a correction toward $83K. However, the pullback has so far remained relatively contained, with the price currently recovering around $84.9K.
The $80K-$82K demand zone is the most important nearby support. Holding above this region would preserve the recent higher-low structure and keep another attack on the highs plausible. A successful daily breakout through the $86K-$89K supply zone could then clear the way for further price discovery.
Conversely, losing the $80K-$82K area would weaken the bullish structure and could expose the deeper $75K-$78K demand zone. The rising moving averages remain substantially below current prices, so a deeper correction could still occur without necessarily reversing the broader trend.
BTC/USDT 4-Hour Chart
The 4-hour chart provides a clearer view of the current consolidation. Bitcoin was rejected from a more concentrated supply zone between approximately $86K and $87.3K, subsequently dropping toward the $83.5K-$84K area.
Since then, volatility has contracted considerably. BTC has formed a tight sideways base before beginning to grind higher toward $85K. This stabilization following the sharp rejection is constructive, but the $86K-$87.3K supply zone remains the decisive obstacle.
A clean breakout and sustained move above $87.3K would indicate that the recent correction has likely run its course and could trigger another impulsive move higher. Until then, the price remains below resistance and vulnerable to another rejection.
On the downside, the $80K-$82K demand zone represents the first major support. If that fails, the broader $75K-$78K region becomes the next significant area where buyers could attempt to regain control.

Sentiment Analysis
The one-week Binance BTC/USDT liquidation heatmap shows a notable imbalance in nearby liquidity. The strongest concentration above the current market appears around $87K-$88K, almost perfectly aligning with the technical supply zone identified on the price charts.
This makes the region particularly significant. If BTC pushes through $86K and begins clearing the $87K-$88K liquidity cluster, short liquidations could contribute to an acceleration of the move.
However, considerable downside liquidity also remains visible. There are notable clusters around $82K and, more importantly, close to $80K-$81K. The latter broadly overlaps with the daily demand zone, reinforcing this area as a key downside target if the current recovery fails.
For now, Bitcoin appears caught between the liquidity below $82K and the larger overhead concentration near $87K-$88K. With price gradually recovering toward the upper cluster, a confirmed break through the supply zone could provide the catalyst for another significant upward move.

The post Bitcoin Price Analysis: Key Support Levels and Liquidity Clusters to Watch This Week appeared first on CryptoPotato.