BTC Bears Eye Sub-$30,000 on Economic Data and SEC Activity
It is a busy Monday for BTC. Economic indicators from China and the US will move the dial. However, SEC-related news will also influence.

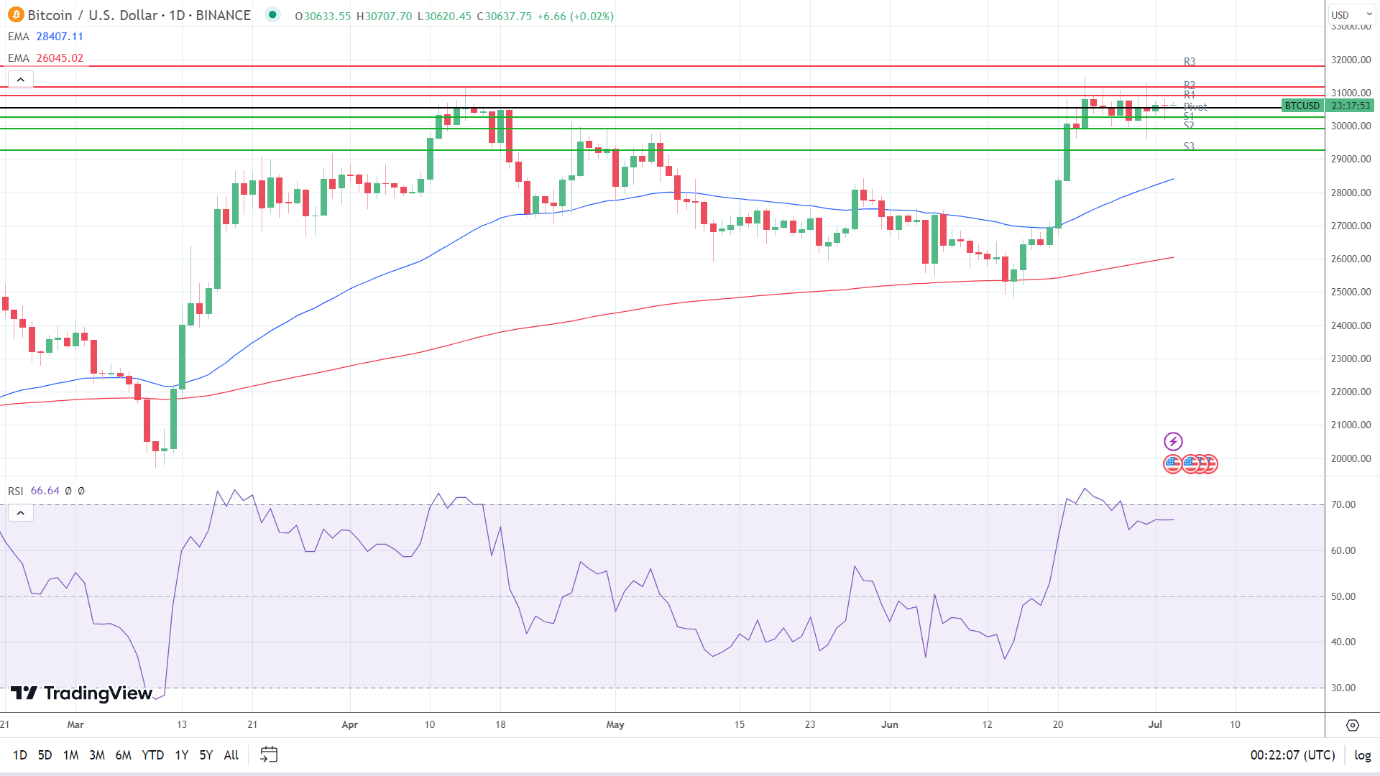
On Sunday, bitcoin (BTC) slipped by 0.02%. Following a 0.56% gain on Saturday, BTC ended the day at $30,631. Despite the bearish session, BTC avoided sub-$30,000 for the second consecutive session.
After a range-bound morning, BTC fell to a mid-afternoon low of $30,183. BTC fell through the First Major Support Level (S1) at $30,386 before rising to a late-session high of $30,816. However, coming up against the First Major Resistance Level (R1) at $30,810, BTC eased back to end the day at $30,631.
Hopes of an SEC Approval of a BTC ETF Provided Support
It was a quiet Sunday session, with no crypto events or economic indicators to influence investor sentiment.
The lack of a catalyst left BTC range bound throughout the Sunday session as investors await comments from the SEC on the spot ETF refilings on Friday.
While hopes of the SEC approving at least one ETF application linger, regulatory uncertainty remains a headwind as Ripple, Binance, and Coinbase battle with the SEC.
The Day Ahead
It is a busy start to the week. Manufacturing PMI numbers from China and the US will draw interest today. An unexpected contraction across the China manufacturing sector and a deeper contraction in the US manufacturing sector would reignite recessionary fears.
However, investors should monitor the crypto news wires. ETF, Binance, and SEC v Ripple-related news will be likely focal points.
With Gary Gensler facing increasing US lawmaker scrutiny, SEC activity and US lawmakers will also need consideration.
Bitcoin (BTC) Price Action
BTC Technical Indicators
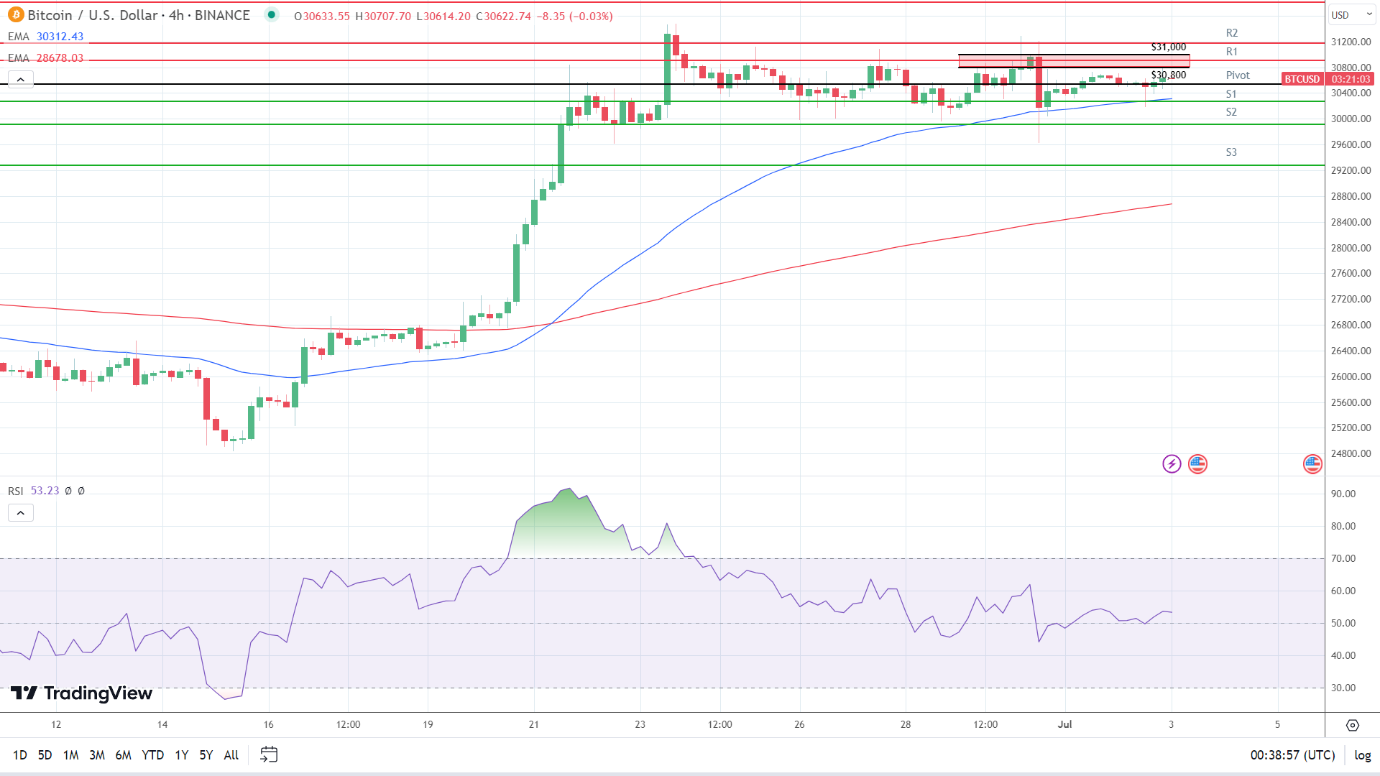
Looking at the EMAs and the 4-hourly candlestick chart (below), the EMAs sent bullish signals. BTC sat above the 50-day EMA ($30,315). The 50-day EMA pulled further away from the 200-day EMA, sending bullish signals.
A hold above the 50-day EMA ($30,315) would support a move through R1 ($30,904) to give the bulls a run at R2 ($31,176) and $31,500. However, a fall through the 50-day EMA ($30,315) would bring S1 ($30,271) and sub-$30,000 Major Support Levels into view. A fall through the 50-day EMA would send a bearish signal.
Looking at the 14-4H RSI, the 53.32 reading sends a moderately bullish signal, aligned with the 50-day and 200-day EMAs. The RSI also supports a run at the resistance band of $30,800 and $31,000.
Resistance & Support Levels
| R1 – $ | 30,904 | S1 – $ | 30,271 |
| R2 – $ | 31,176 | S2 – $ | 29,910 |
| R3 – $ | 31,809 | S3 – $ | 29,277 |