Here’s the Imminent Support to Watch as Bitcoin Tumbles Below $31K (BTC Price Analysis)
Bitcoin has been struggling to surpass the significant resistance region of $30K for some time now, despite an overall bullish outlook. Recent price movements have shown bearish signals that could potentially lead to a short-term reversal.

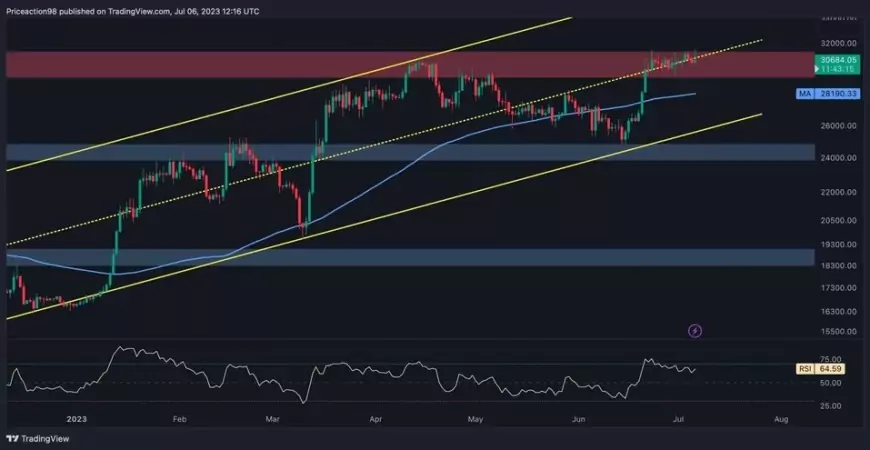
The Daily Chart
Bitcoin’s bullish rally has come to a halt upon reaching the crucial resistance region of $30K. This price range holds significant psychological resistance and has acted as a major barrier to the price for several months.
However, there are indications of a double-top bearish reversal pattern forming in conjunction with declining and weakening bullish momentum. This suggests the possibility of a reversal and a consolidation phase before the market determines its next direction.
It’s important to note that if the price is rejected at this critical resistance, a drop toward the dynamic support level of the 100-day moving average at $28K becomes highly likely.
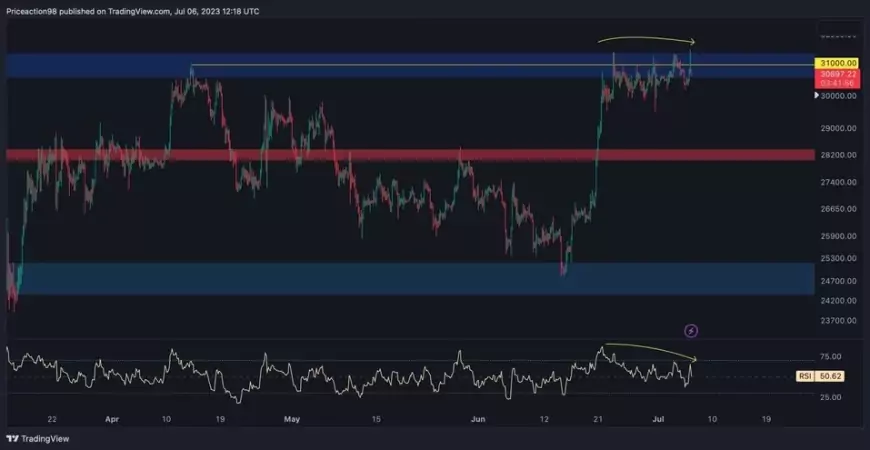
The 4-Hour Chart
In the 4-hour timeframe, the diminished bullish momentum becomes more apparent as the price has been consolidating around the $30K mark for an extended period. Following a prolonged period of consolidation, a bearish double-top pattern has emerged, causing a slight decline as selling pressure outweighs demand.
However, it is important to wait for confirmation of the double-top pattern, which requires the price to fall below the neckline at $29.8K. If successful, Bitcoin’s next target would be the static support region at $27.5K.
Furthermore, it is worth mentioning that a clear bearish divergence is visible between the RSI indicator and the price, increasing the likelihood of a short-term downturn.
In summary, Bitcoin is currently facing significant resistance at the $30K level, accompanied by bearish signals and weakening bullish momentum. A reversal and consolidation phase may be in the cards, potentially leading to a short-term decline.
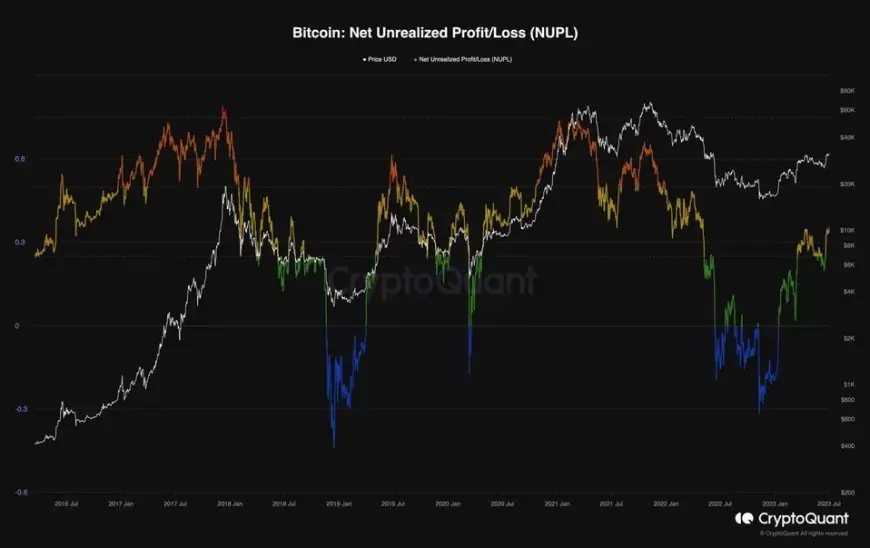
On-chain Analysis
Bitcoin’s price has been on a strong bullish rally since the start of 2023, leading to profitable returns for many investors. The NUPL metric, illustrated on the chart, represents the disparity between market cap and realized cap divided by market cap. Essentially, this metric serves as an indicator of the proportion of investors who are in a profitable state.
Values above 0 indicate that investors are making profits, and a rising trend suggests an increasing number of investors entering the profitable zone. The recent upward movement in the NUPL metric, which reached its previous high from April, implies that more investors are now experiencing profitable returns. This serves as a significant indication of the prevailing bullish sentiment in the market.
Consequently, if the metric surpasses its previous high simultaneously with further price appreciation, it would generate heightened buying pressure and establish an unequivocally bullish market condition.