BTC Fear & Greed Index Goes Neutral on FTX News and a BTC Rebound
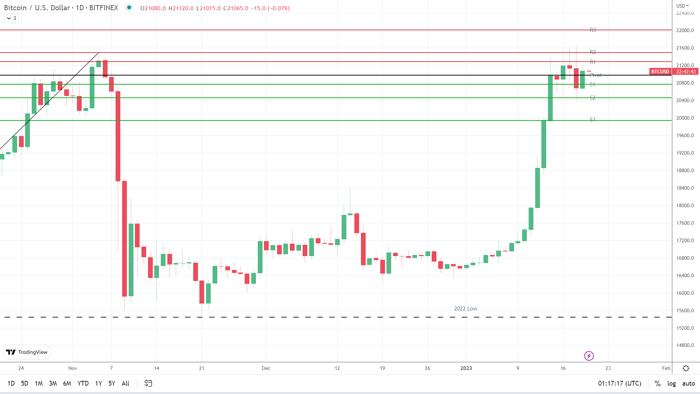
On Thursday, bitcoin (BTC) rallied by 1.91%. Reversing a 2.14% loss from Wednesday, BTC ended the day at $21,080. Notably, BTC ended the day at $21,000 for the third time in four sessions.

On Thursday, bitcoin (BTC) rallied by 1.91%. Reversing a 2.14% loss from Wednesday, BTC ended the day at $21,080. Notably, BTC ended the day at $21,000 for the third time in four sessions.
A mixed start to the day saw BTC slip to an early low of $20,670 before making a move. Steering clear of the First Major Support Level (S1) at $20,182, BTC rallied to a late high of $21,187. However, coming up short of the First Major Resistance Level (R1) at $21,413, BTC eased back to end the day at $21,080.
FTX News Mutes Fed Policy Sentiment and US Recession Fears
US economic data came in hotter than expected on Thursday. Initial jobless claims fell from 205k to 190k, the first visit to sub-200k since September. The all-important Philly Fed Manufacturing Index rose from -13.7 to -8.9, easing fears of a near-term hard landing.
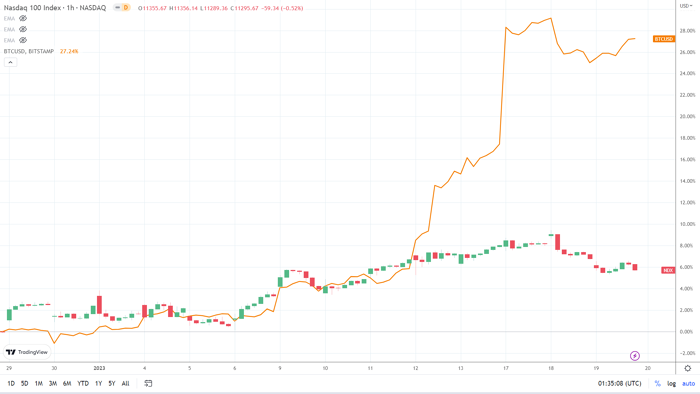
However, tighter labor market conditions could give the Fed reason to take a more aggressive interest rate path that could deliver a hard landing. The NASDAQ Composite Index and the S&P 500 responded to the numbers, falling by 0.96% and 0.76%, respectively.
After the closing bell, Netflix (NFLX) recovered losses from the session. A pickup in subscribers supported an after-hours rally, supporting BTC and the broader crypto market.
While the US economic indicators raised the threat of a more hawkish Fed, crypto market news delivered a bullish Thursday session. The talk of an FTX reboot eased FTX contagion risk and supported a BTC and broader crypto market rally.
According to the Wall Street Journal, new FTX chief John J. Ray III said he set up a task force to investigate restarting FTX.com. Reportedly, some customers have lauded the technology and intimated there would be value in a restart.
Today, US economic indicators will likely have a muted impact on BTC. Housing sector numbers will leave FOMC member chatter to influence. The talk of a 50-basis point interest rate hike could spook investors.
Investors should also monitor the crypto news wires for updates on FTX and the ongoing SEC v Ripple case.
This morning, the NASDAQ mini was up 40 points.
The Fear & Greed Index Bounces Back into the Neutral Zone
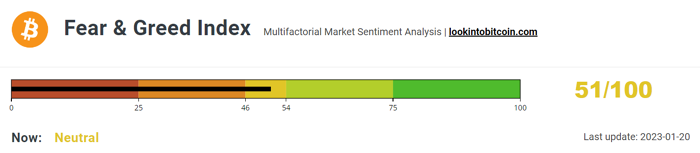
Today, the BTC Fear & Greed Index jumped from 45/100 to 51/100. Significantly, the Index returned to the Neutral zone, supported by the BTC return to $21,000.
Subsiding FTX contagion risk muted market reaction to the US labor market numbers. An FTX reboot would remove the threat of further fallout and allow the new leadership to implement the appropriate control mechanisms to protect investors.
However, regulatory risk remains a crypto market headwind, with the SEC continuing to regulate by enforcement. The lack of a regulatory framework will leave the market on tenterhooks and could affect the BTC road to recovery.
Near-term, the Index would need to return to the Greed zone (55/100) to support a BTC run at $25,000. The Index last visited the Greed zone in March 2022.
Bitcoin (BTC) Price Action
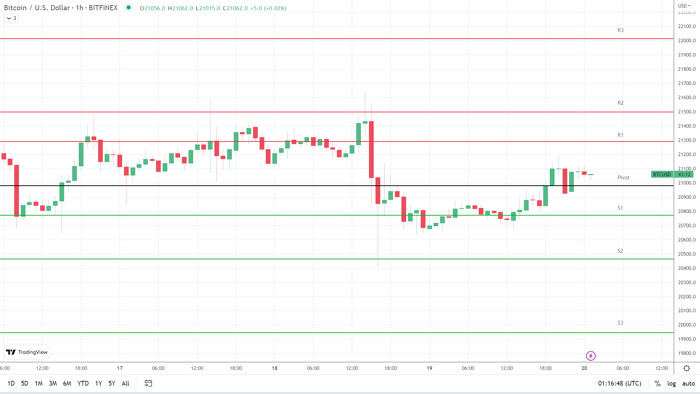
At the time of writing, BTC was down 0.07% to $21,065. A range-bound start to the day saw BTC rise to an early high of $21,120 before falling to a low of $21.015.
Technical Indicators
BTC needs to avoid the $20,979 pivot to target the First Major Resistance Level (R1) at $21,288. A move through the Thursday high of $21,187 would support a bullish session. However, the crypto news wires and FOMC member chatter should be market-friendly to deliver a breakout.
In the event of an extended rally, BTC would likely test the Second Major Resistance Level (R2) at $21,496 and resistance at $21,500. The Third Major Resistance Level (R3) sits at $22,013.
A fall through the pivot would bring the First Major Support Level (S1) at $20,771 into play. Barring a risk-off-fueled sell-off, BTC should avoid sub-$20,500 and the Second Major Support Level (S2) at $20,462. The Third Major Support Level (S3) sits at $19,945.
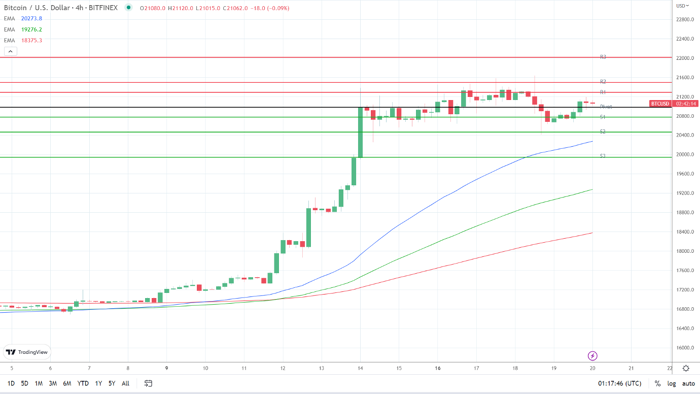
Looking at the EMAs and the 4-hourly candlestick chart (below), it was a bullish signal. BTC sat above the 50-day EMA, currently at $20,274. The 50-day EMA pulled away from the 200-day EMA, with the 100-day EMA widening from the 200-day EMA, delivering bullish signals.
A hold above the Major Support Levels and the 50-day EMA ($20,274) would support a breakout from R1 ($21,288) to target R2 ($21,496) and $21,500. However, a fall through S1 ($20,771) would bring S2 ($20,462) and the 50-day EMA ($20,274) into view. A fall through the 50-day EMA would signal a shift in sentiment.